
Figure 3.
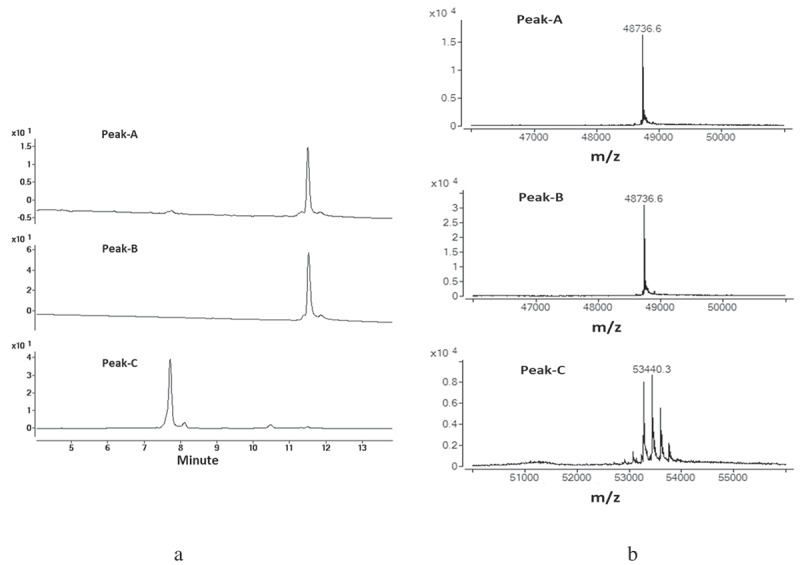
Enzymatically digested mAb-1 domains were separated by CEX and the three major peaks (Peak-A, Peak-B, and PeakC) were collected. The collected fractions were analyzed by RPLC-MS . Peak-A and Peak-B demonstrated the same retention time and same mass. (a) UV spectrum of the three major peaks. (b) Deconvoluted mass spectrum for the three major peaks.