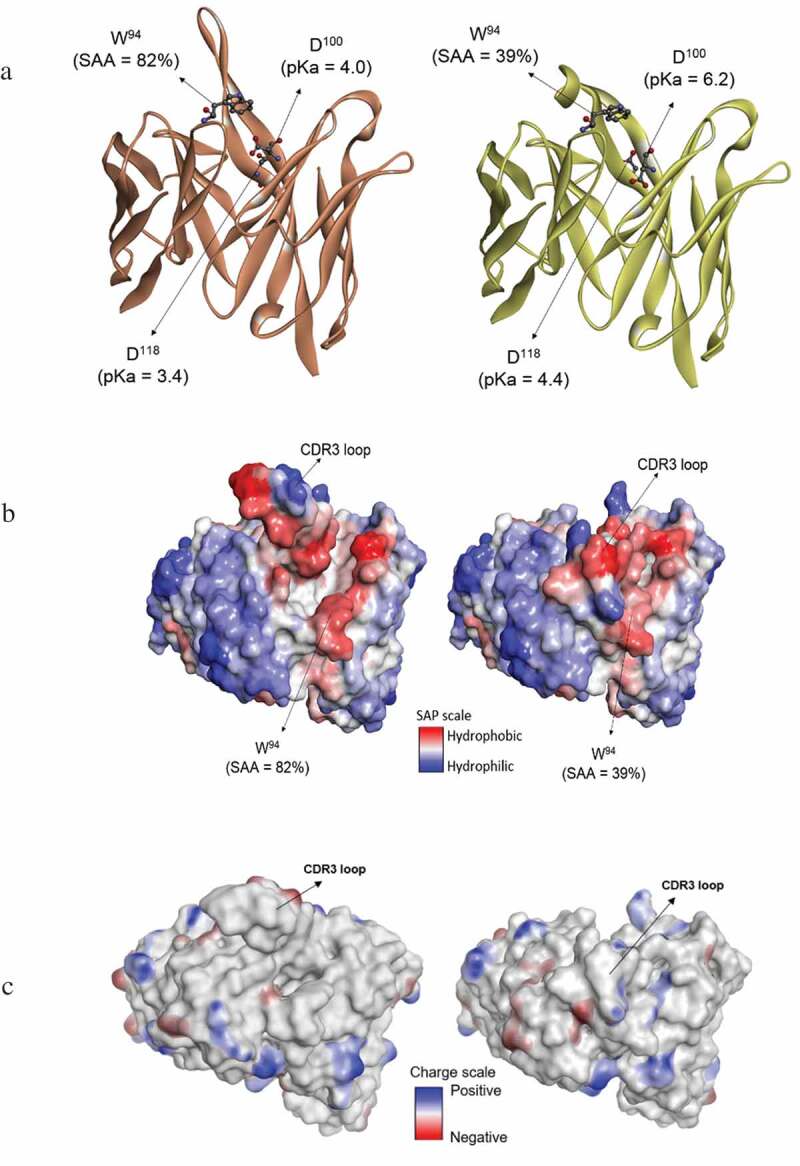
Figure 5.

Comparison of molecular modeling results for the "open" and "closed" loop conformations. (a) Structures labeled with select pKa and solvent accessible surface area (SAA). (b) Hydrophobicity maps. (c) Charge analysis showing contiguous, charge surface patches.
