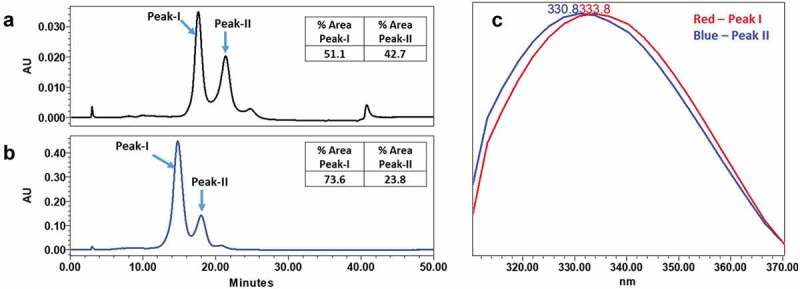
Figure 7.

Analysis of mAb-1 using HIC. mAb-1 demonstrated two main peaks (peak I and peak II) in HIC analysis, and the two main peaks exhibited different intrinsic fluorescence. pH dependence of the interconversion of peak-I and peak-II were demonstrated using HIC by increasing the initial pH of the mobile phase. (a) HIC chromatographs of intact mAb-1 using acidic (pH 4.6) mobile phase. (b) HIC chromatographs of intact mAb-1 using near neutral mobile phase (pH 6.4). (c) Fluorescence profile of peak-I and peak-II.
