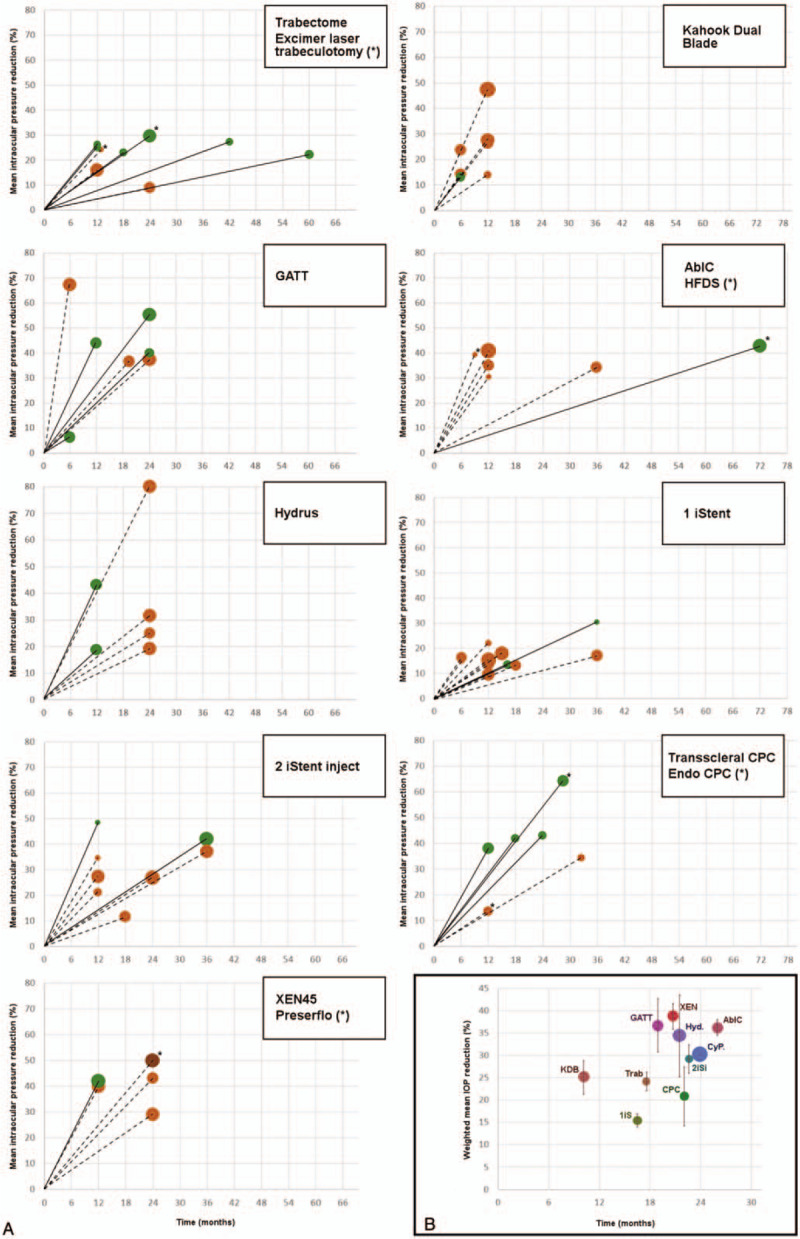
FIGURE 3.

A, Percentage of intraocular pressure reduction reported at the final timepoint of each analyzed study. The size of the dots is proportional to the reduction in antiglaucoma medications. Solid lines represent studies of standalone procedures, whereas dotted lines represent studies of combined procedures. The asterisks mark alternative procedures. B, Weighted mean intraocular pressure reduction of all reported studies for each surgical technique. The vertical bars show the 95% confidence interval. 1iS indicates 1 iStent; 2iSi, 2 iStent inject; AbIC, ab interno canaloplasty; CPC, cyclophotocoagulation; CyP., CyPass; GATT, gonioscopy-assisted transluminal trabeculotomy; Hyd., hydrus; IOP, intraocular pressure; KDB, Kahook Dual Blade; Trab, trabeculotomy; XEN, XEN45 gel stent.
