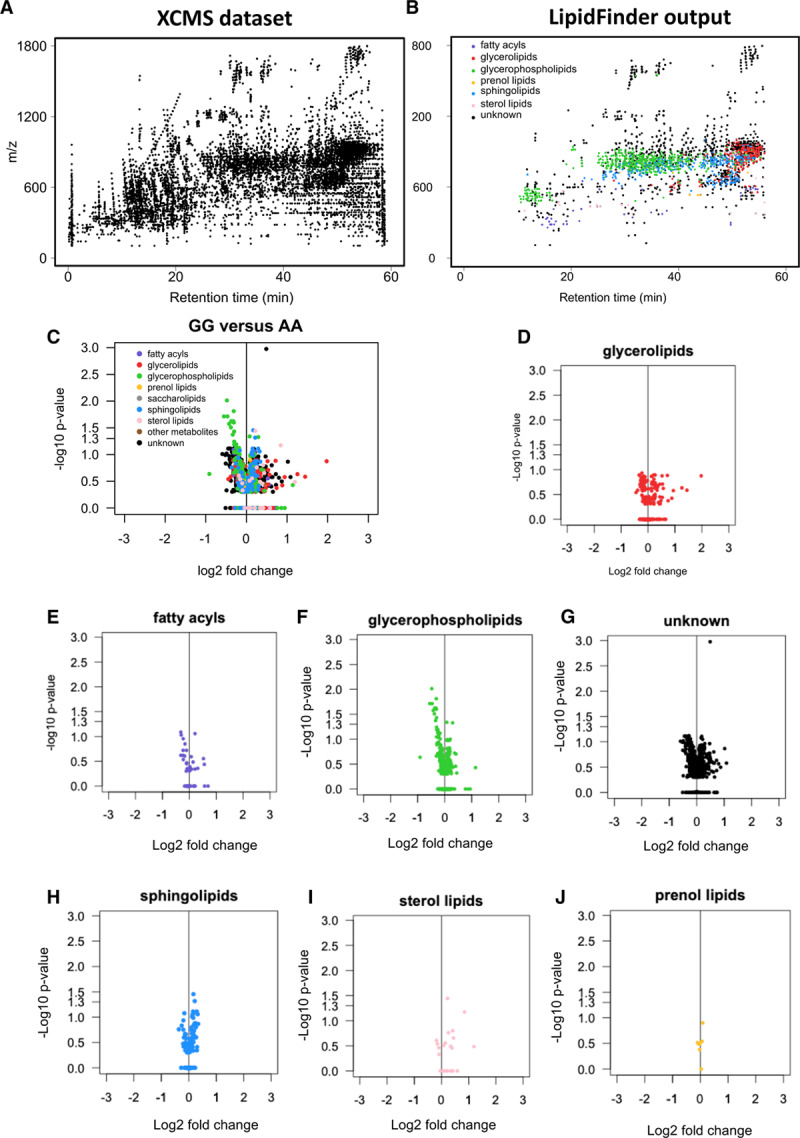
Figure 1.

Global lipidomics reveals class-specific changes in glycerophospholipids (GPLs) in rs10757274 GG vs AA. A, Scatterplot of features in a plasma sample (≈14 000) after processing high-resolution MS data using XCMS. Analysis was undertaken using parameters provided in Materials in the Data Supplement. B, Scatterplot obtained after LipidFinder and manual-data clean-up, as described in Methods. Each dot represents a lipid described by m/z value and retention time. Putative identification and assignment of category were performed using WebSearch of the curated LIPID MAPS database. C–J, Volcano plots show differences in lipid classes with genotype. Volcano plots were generated as described in Methods, plotting log2(fold change) vs −log10(P value) for all (n=39 AA and 33 GG), following P value adjustment using sequential goodness of fit metatest (SGoF).
