
Figure 4.
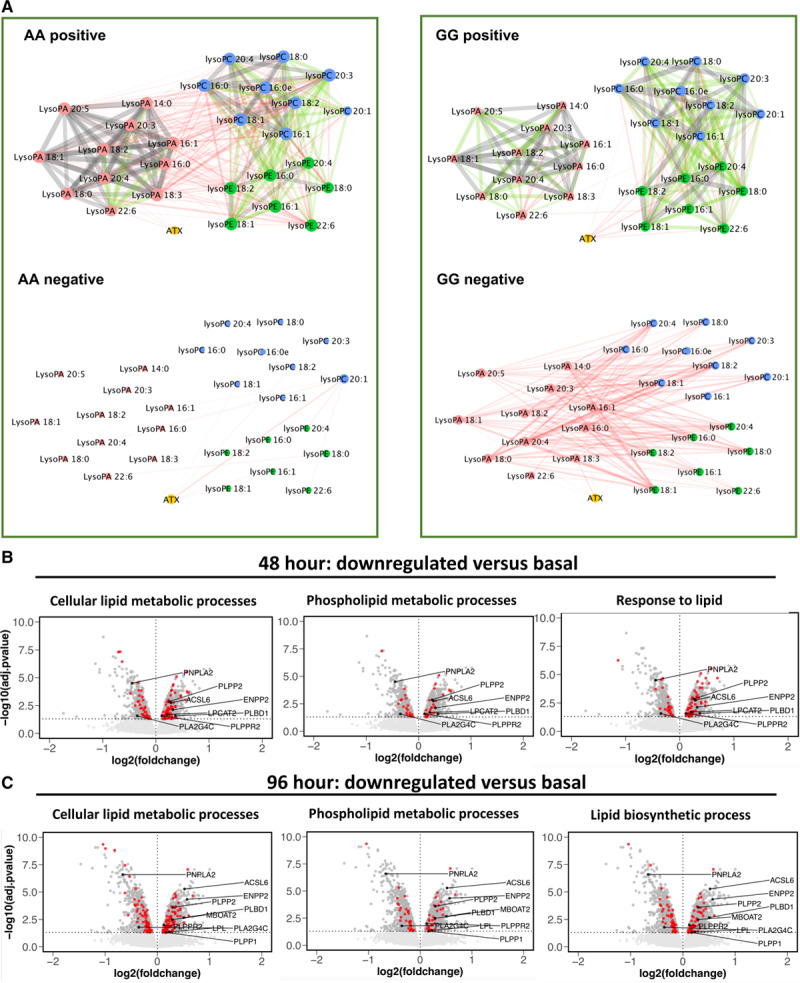
Cytoscape analysis of lipids reveals divergent metabolism in GG vs AA, while ANRIL knockdown is associated with significant changes to lysoPL (lysophosphospholipids)/lysoPA (lysophosphatidic acid)-metabolizing genes. A, Cytoscape reveals strong links within related families, but a positive-negative switch for lysoPL-lysoPA correlations between AA-GG plasmas. Pearson correlation networks were generated for the AA and GG validation samples (n=47 AA and 49 GG), using lipid concentrations. Nodes are colored by lipid sub-category and represent individual molecular species, and edges represent the correlation. Edges detail the Pearson correlation coefficients between nodes (lipids), where the width of the edge denotes value. Additionally, edges are colored by value: red (r=0.10–0.39); green (r=0.40–0.69); gray (r=0.70–1.00). C and D, Significant changes in lipid regulatory gene expression are observed with ANRIL knockdown in cell culture. Affymetrix array data generated in Congrains et al5 was analyzed using GO as described in Methods. Volcano plot showing differential gene expression of all genes on the Affymetrix HuGene1.0 v1, chip. LysoPL/lysoPA regulating genes that alter in line with decreased levels of the lipids in GG plasma are labeled. The horizontal dashed line shows where adj. P value <0.05 (Benjamini-Hochberg correction) where points (genes) above this line are significantly differentially expressed. LysoPL-regulating genes that alter in line with decreased levels of the lipids are labeled in black. Genes in red are annotated to the GO term detailed in the plot title. Data are plotted in R using ggplot2. B, Forty-eight hour shRNA knockdown. C, Ninety-six hour shRNA knockdown.