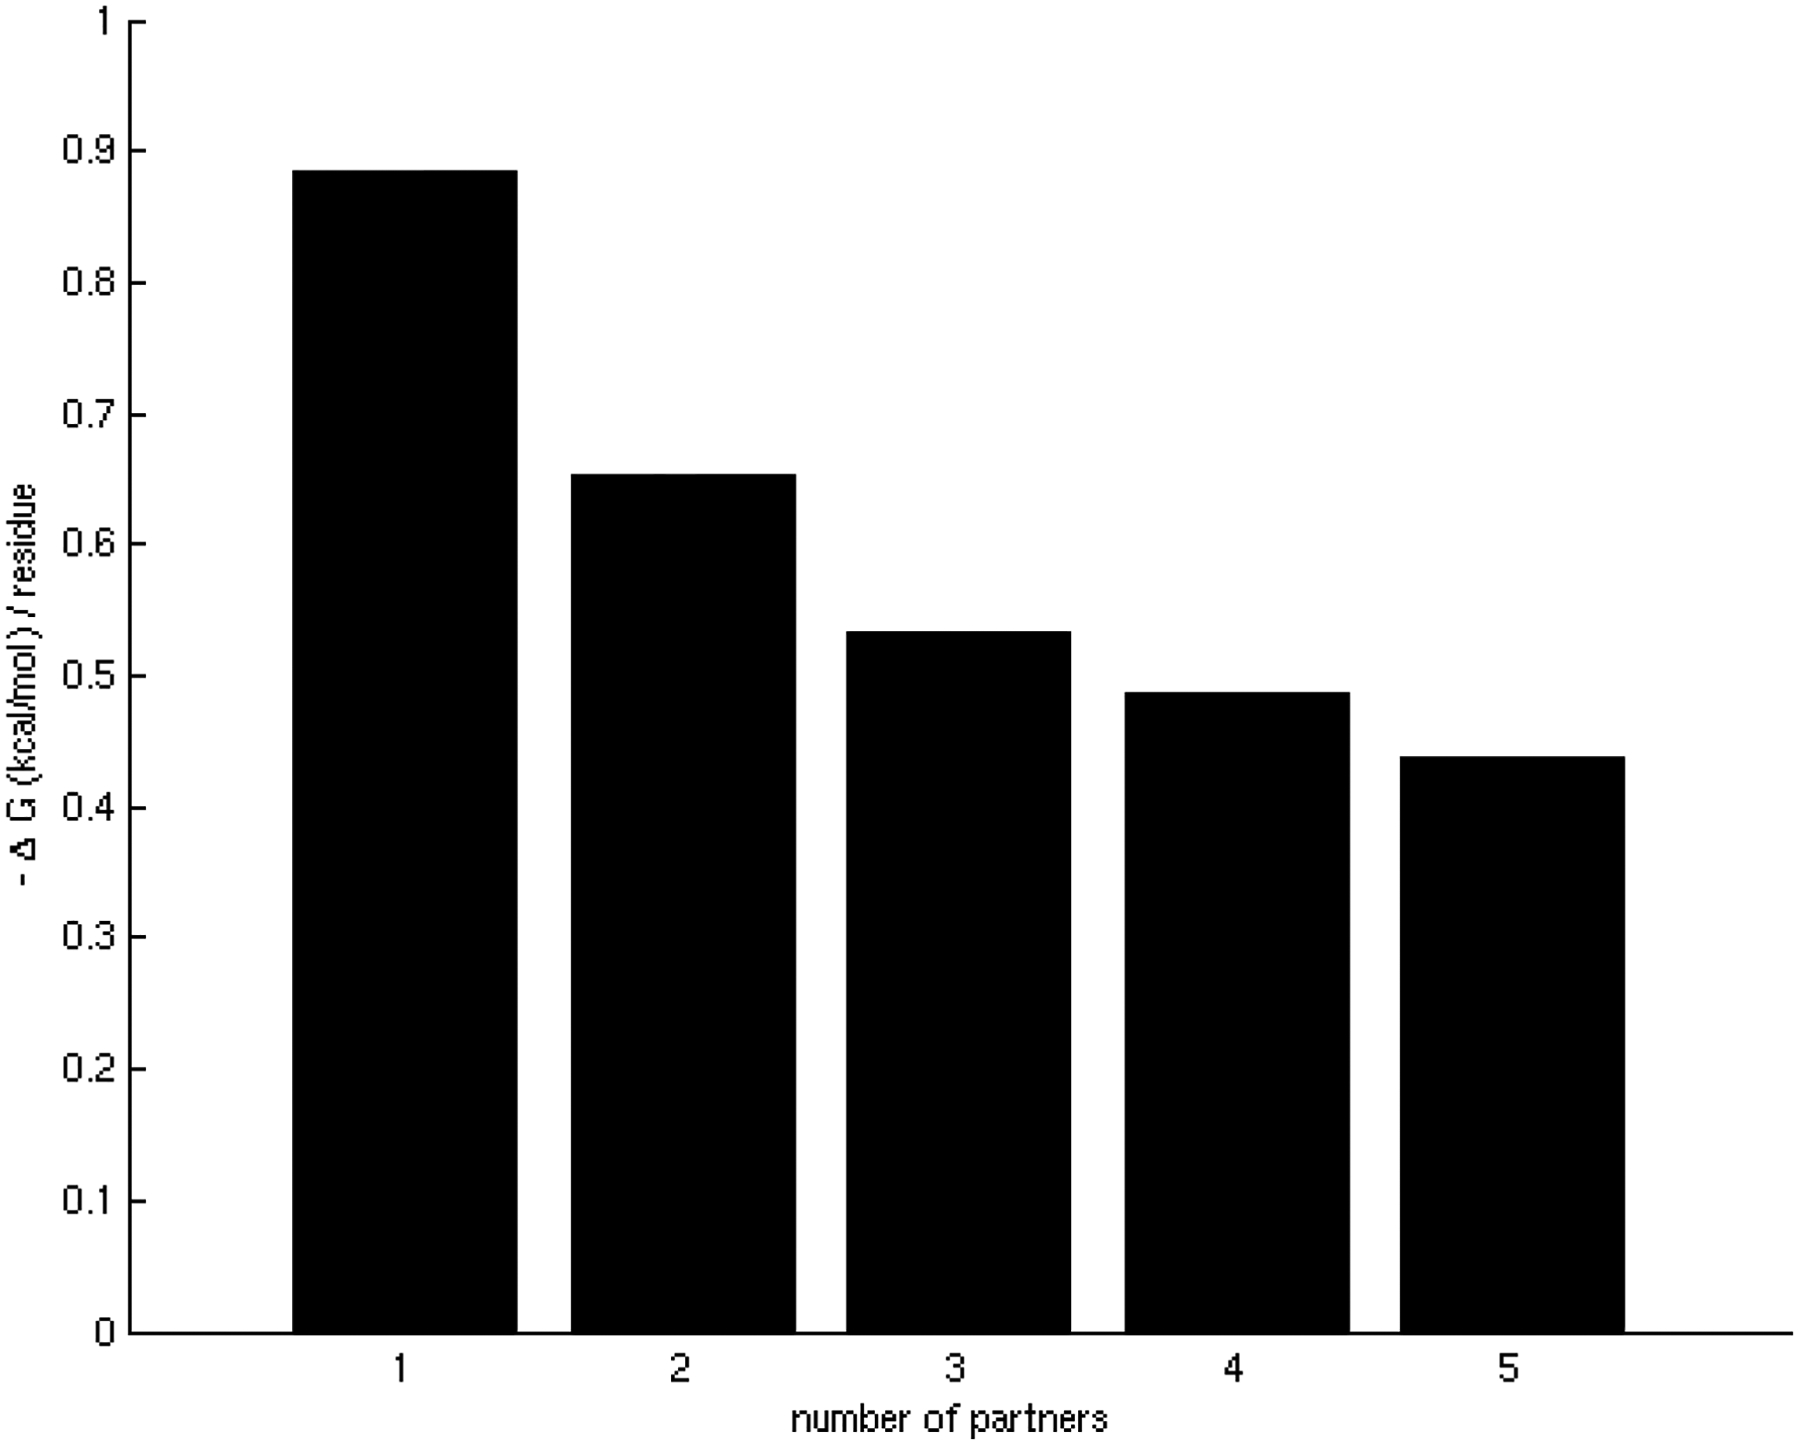
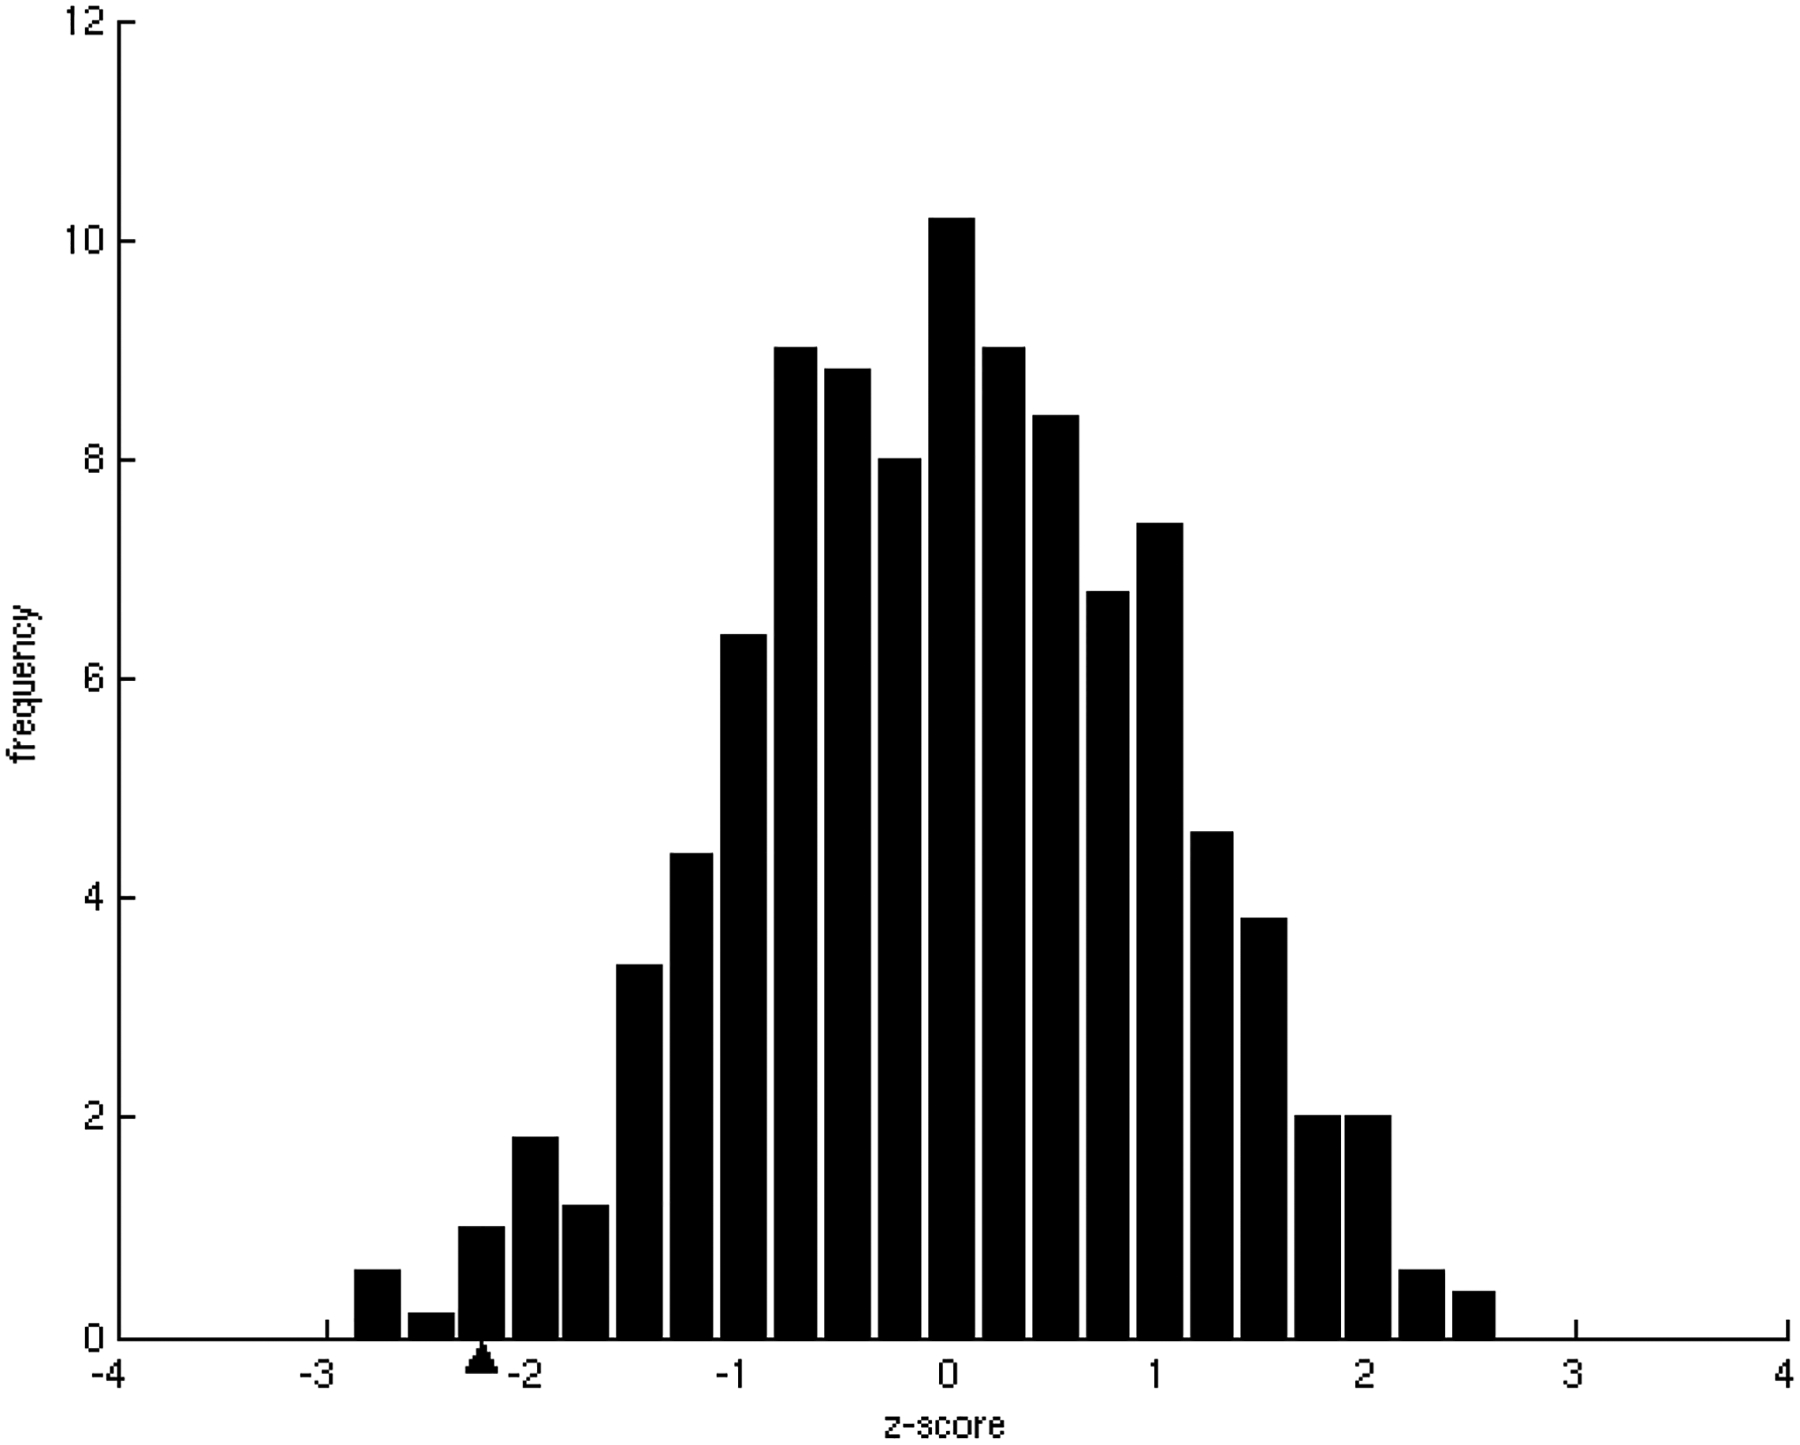
Figure 1.


Relationship between the number of interacting partners (specificity/promiscuity) and binding energy per residue (affinity).
A) Binding energy per residue in binding sites averaged for different number of partners in binding sites. There is a clear tendency for the binding affinities to become weaker as the number of interacting partners of binding sites increases.
B) Z-score frequency distribution of the correlation coefficients of 500 randomizations of the binding energies. In our dataset, the observed tendency, marked with a black triangle, has a statistically significant z-score = −2.17(p-value = 1.50 × 10⁻²).
