Figure 5.


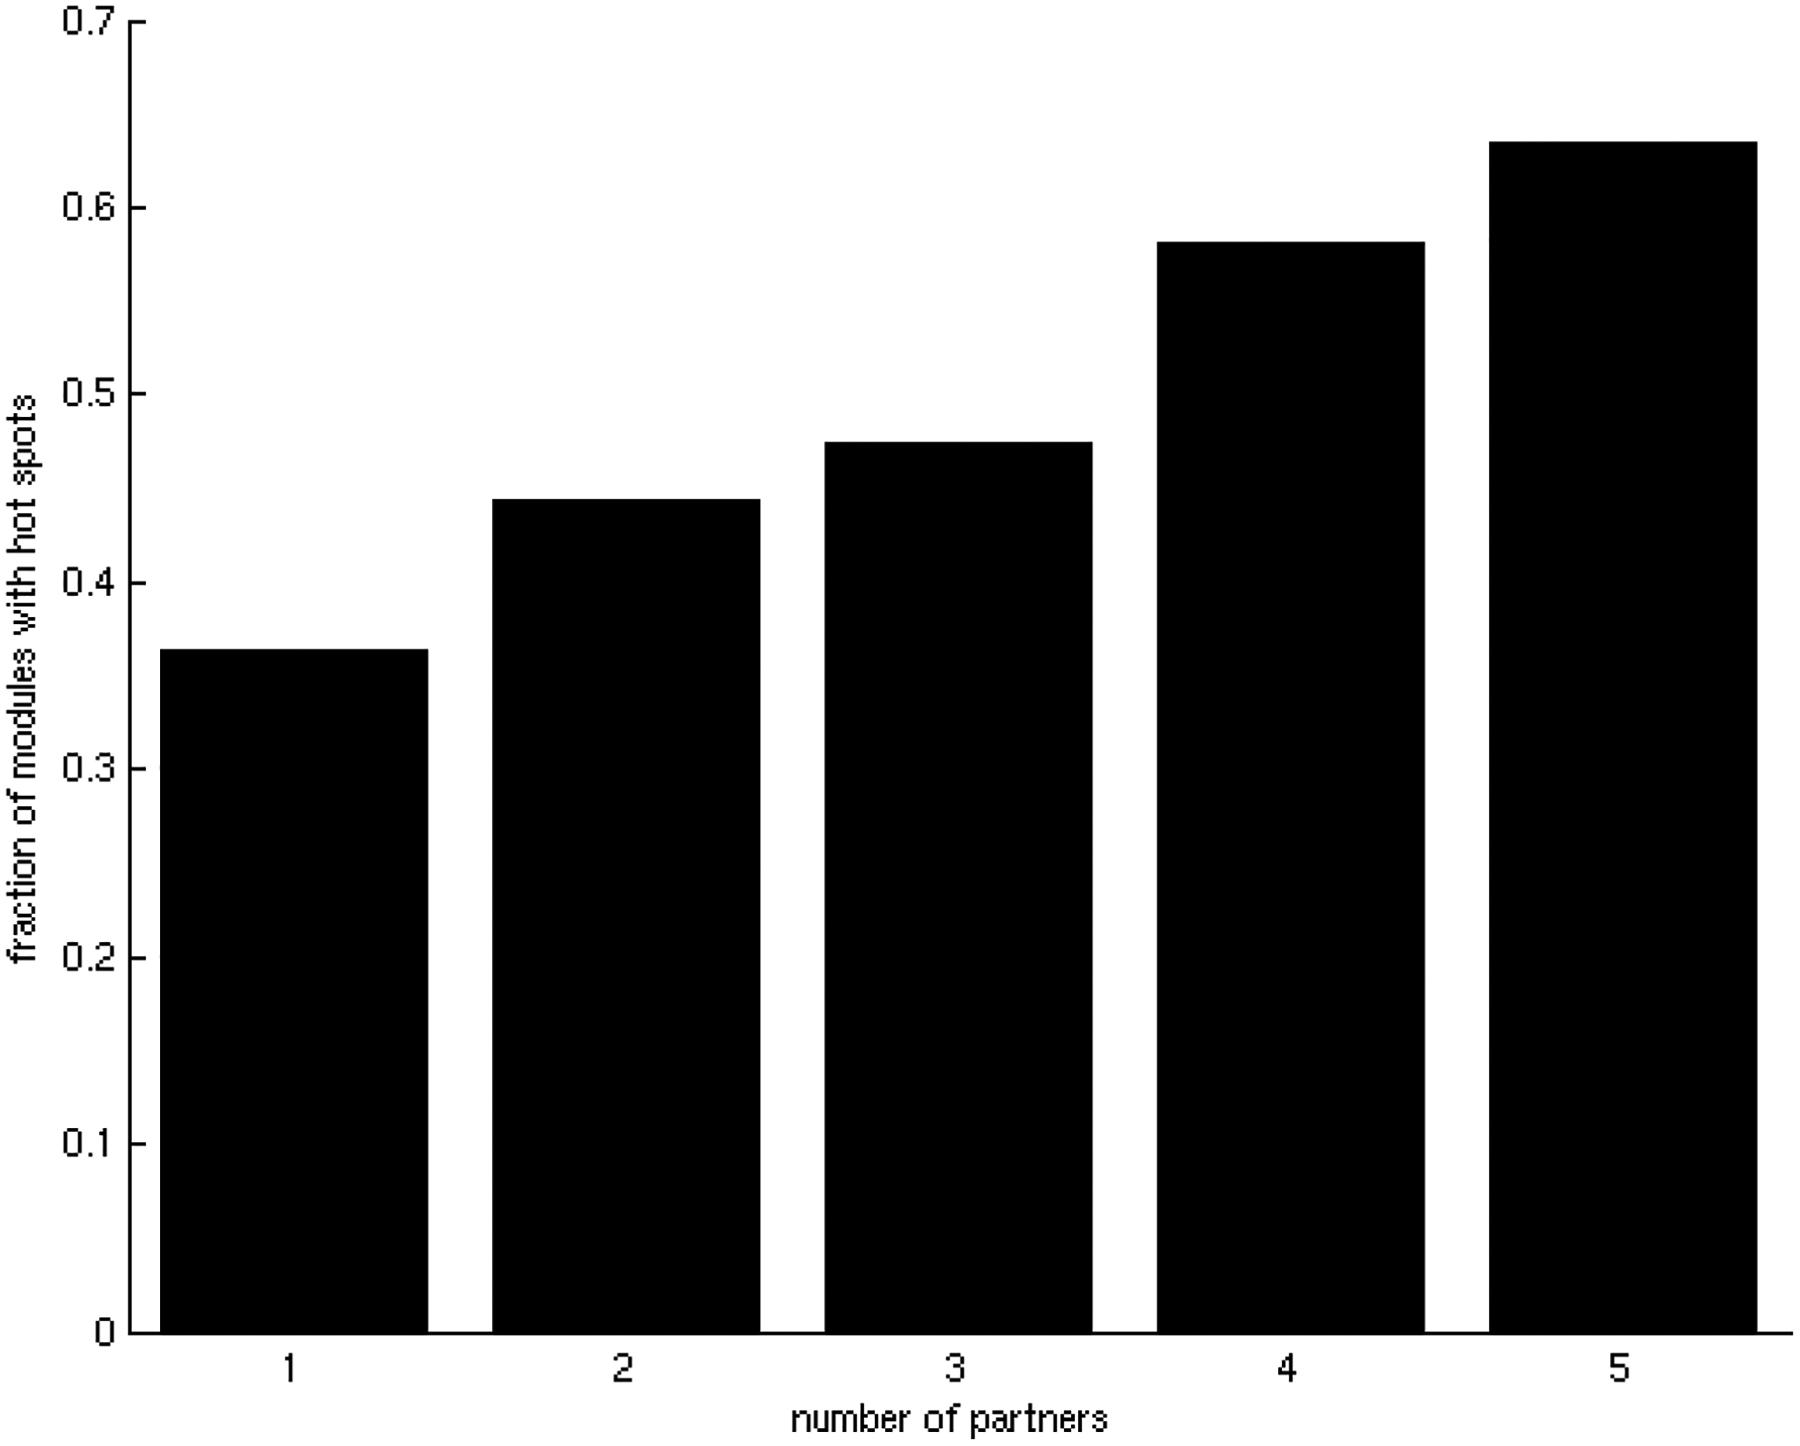
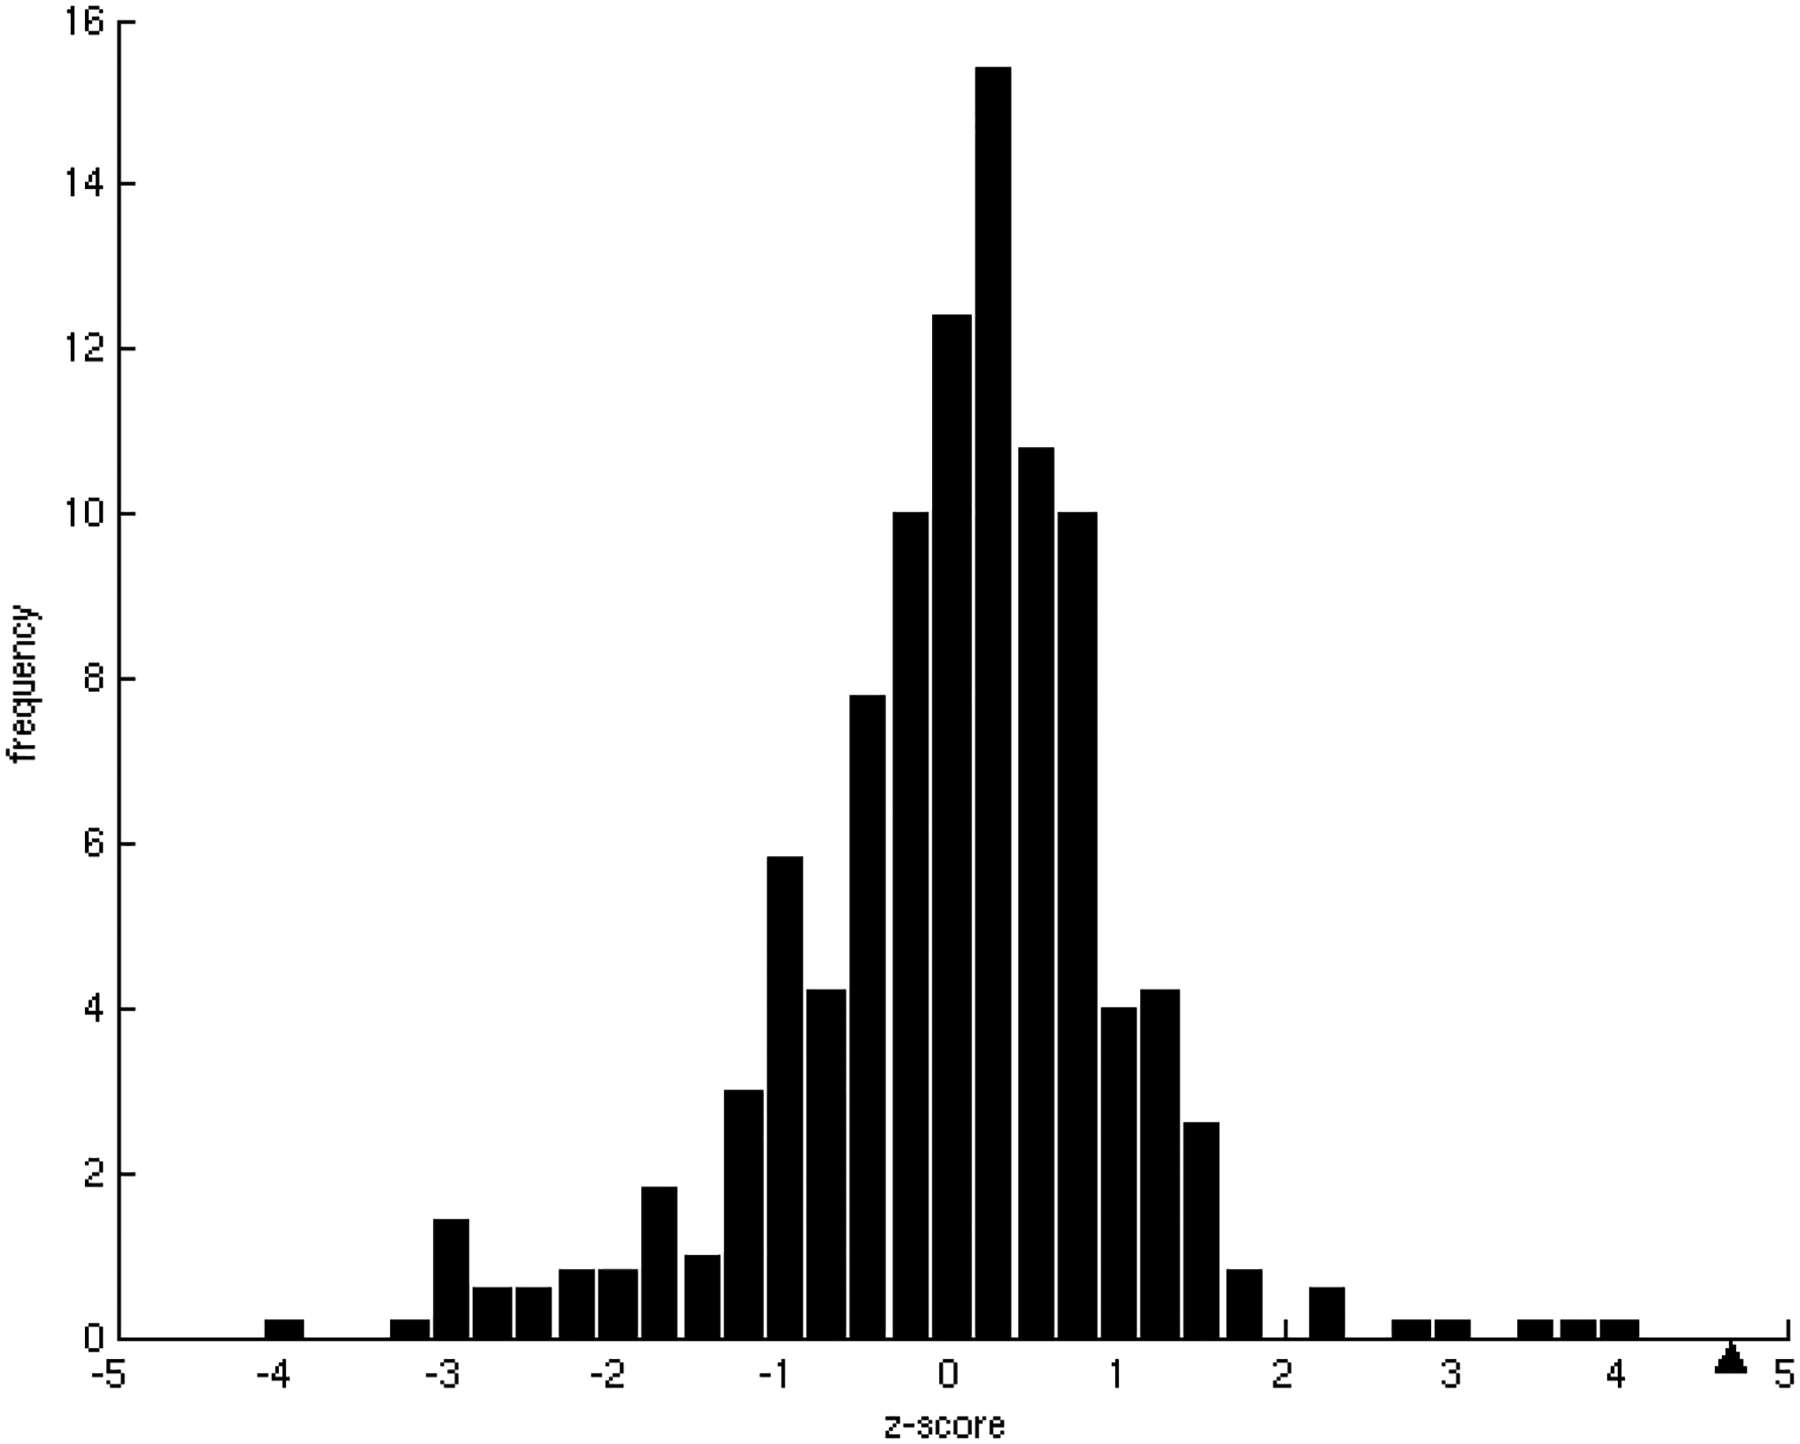
Relationship between the averaged fraction of modules with hot spots and specificity in the binding sites.
A) Relationship between the averaged fraction of modules containing hot spots in binding sites and specificity. There is a clear tendency for the modular distribution of hot spots to increase with binding site promiscuity.
B) Z-score frequency distribution of the correlation coefficients for 500 randomizations of the binding energies. In the dataset of this study, the tendency, marked with a black triangle, was found to have a statistically significant z-score = 5.24 (p-value = 8.03 × 10⁻⁸).
