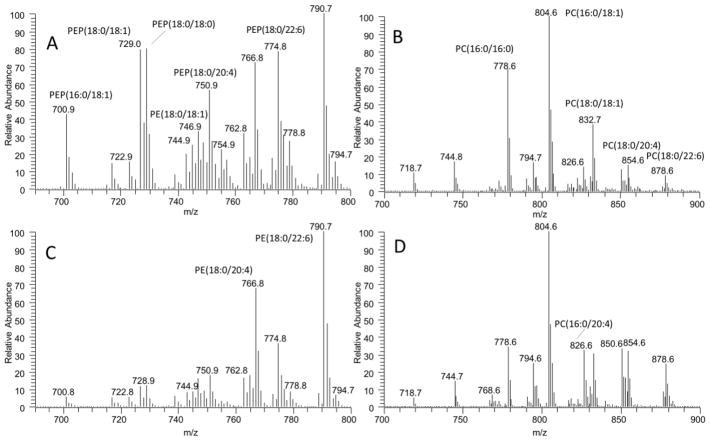
Fig. 5.
Representative mass spectra of PE (A) and PC (B) in brain tissue and PE (C) and PC (D) in brain mitochondria. The peaks at m/z 700.9, 729.0, and 746.9 corresponding to PEP(16:0/18:1), PEP(18:0/18:1), and PE(18:0/18:1) are higher in brain tissue than mitochondria (A and C). Similarly, the peaks at m/z 778.6 and 832.7 corresponding to PC(16:0/16:0) and PC(18:0/18:1) are higher in brain tissue than mitochondria (C and D).

