
Figure 4.
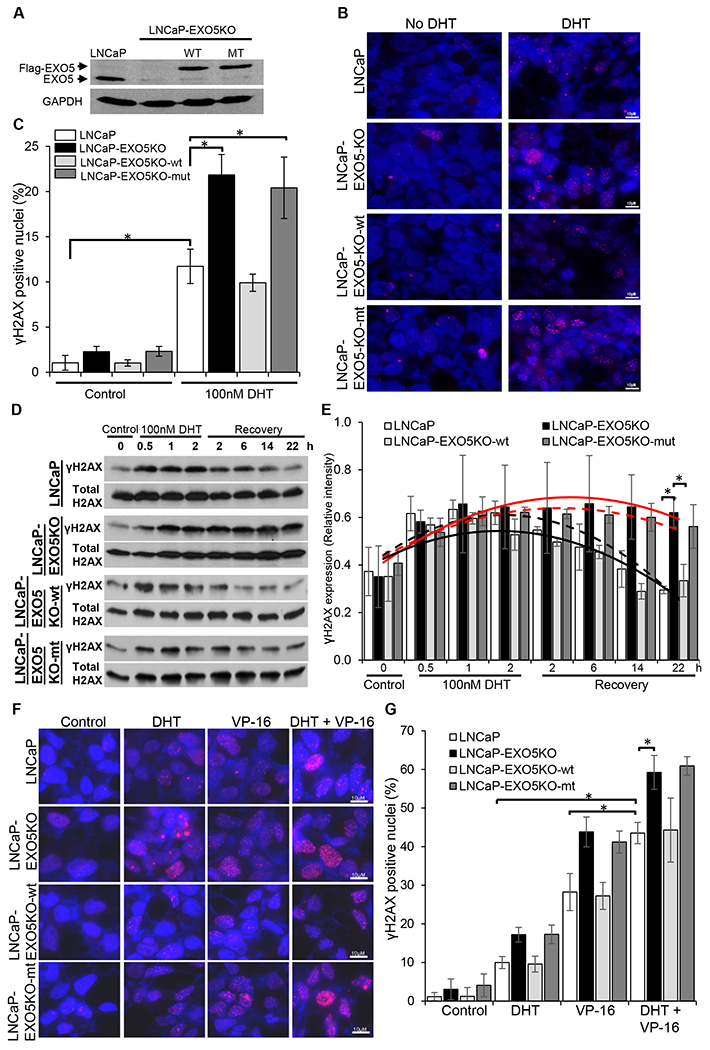
Knockout of EXO5 promotes DHT-induced DNA damage in androgen-sensitive PCa cells. (A) Western blot analysis of endogenous EXO5 and overexpressed FLAG-tagged wild-type (WT) and mutant (MT) EXO5 in an LNCaP EXO5 knockout (KO) cell line. (B) Immunofluorescence images of DHT-treated (100 nM, 2 h) parental LNCaP and LNCaP-EXO5KO cells, overexpressing WT or MT EXO5, stained for γH2AX. (C) The quantification of γH2AX-positive nuclei (5 or more foci present in the nucleus) per field in cells transfected and treated as described in Figure 4B. Data shown are mean ± standard deviation of three fields per experiments from 3 independent experiments. *P< 0.05. (D) Time-course assay of γH2AX expression using western blot analysis of cell lysate from LNCaP and LNCaP-EXO5-KO cells, overexpressing WT or MT EXO5, untreated and after DHT treatment (100 nM, 2 h) or recovery (incubation in media without DHT) for the indicated times. (E) The quantification of mean band intensity ± standard deviation, indicating phospho-γH2AX expression, in three independent experiments, as represented in Figure 4D. *P < 0.05. Black solid line: LNCaP cells, Red solid line: LNCaP-EXO5KO cells. Black dash line: LNCaP-EXO5KO-wt cells, Red dash line: LNCaP-EXO5KO-mut cells. (F) Immunofluorescence images of parental LNCaP, EXO5-KO, and WT EXO5-overexpressing EXO5-KO cells after treatment with DHT (100 nM, 2 h) and/or the TOP2 inhibitor VP-16 (10μM, 30 min), stained for γH2AX. (G) The quantification of γH2AX-positive nuclei (10 or more foci present in nucleus) per field in LNCaP, EXO5-KO, and WT EXO5-overexpressing EXO5-KO cells treated as described in Figure 4F. Data shown are mean ± standard deviation of three fields per experiments from 3 independent experiments. *P < 0.05.