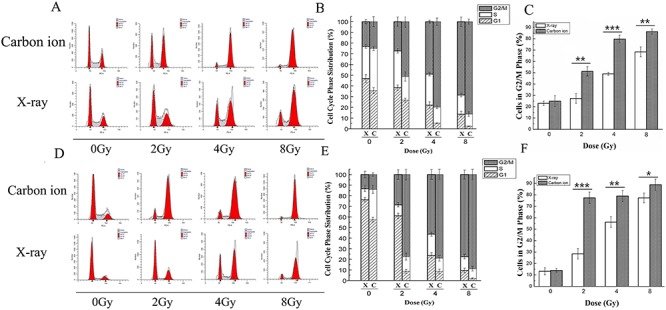
Fig. 2.

The different effects of X-ray and carbon ion irradiation on the cell cycle phase distribution in MDA-MB-231 and MCF-7 cells. The cells were irradiated by X-rays or carbon ions at doses of 0, 2, 4 and 8 Gy, and then the cell cycle phase distribution was determined by flow cytometry 48 h after irradiation. The DNA fluorescence histograms show the distribution of specific cell populations in the G1, S and G2/M phases in MDA-MB-231 (A) and MCF-7 (D) cells. The stacked plot shows the percentage of cells in the G1, S and G2/M phases in MDA-MB-231 (B) and MCF-7 (E) cells. The bar graphs show the percentage of MDA-MB-231 cells (C) and MCF-7 cells (F) in the G2/M phases. Cells were stained using PI and subjected to flow cytometric analysis, which included 20 000 events. Data are the mean ± SD of three independent experiments. *P < 0.05, **P < 0.01 and ***P < 0.001 by one-way ANOVA.
