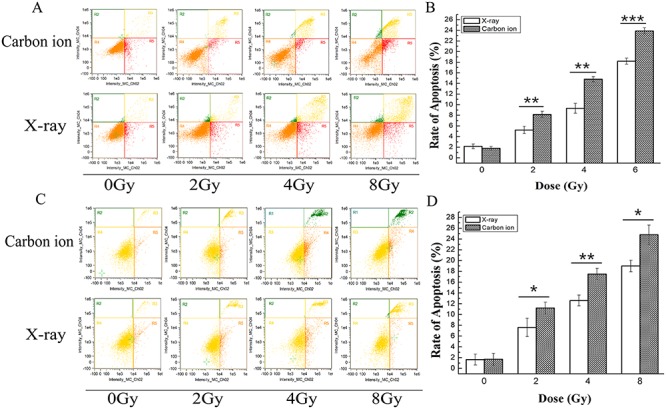
Fig. 4.

Apoptosis induced by X-rays or carbon ions in MDA-MB-231 and MCF-7 cells determined by flow cytometry 48 h after irradiation. The flow cytometric dot plots show the percentage of specific cell populations (live, early apoptosis and late apoptosis) in MDA-MB-231 (A) and MCF-7 (C) cells irradiated with X-rays or carbon ions at doses of 0, 2, 4 and 8 Gy. The bar graphs show the percentage of late apoptotic MDA-MB-231 (B) and MCF-7 (D) cells. Cells were double-stained with annexin V/PI to detect cells undergoing early and late apoptosis, which collected 10 000 events. Data are the mean ± SD of three independent experiments. *P < 0.05, **P < 0.01 and ***P < 0.001 by one-way ANOVA.
