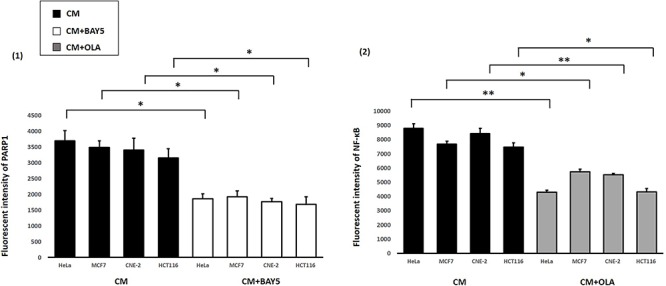
Fig. 13.

Fluorescent intensities of PARP1 and NF-κB obtained after treatments with (1) CM and CM + BAY5 and (2) CM and CM + OLA, in HeLa, MCF7, CNE-2 and HCT116 cells. Data were analysed using Student’s t-test: two-sample assuming unequal variances following one-way ANOVA. *P < 0.05, **P < 0.01 and error bars represent mean ± SD.
