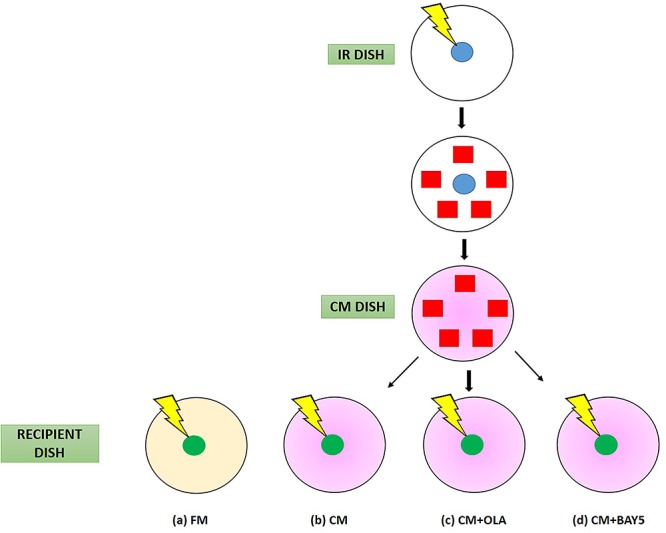
Fig. 2.

Schematic diagrams showing experimental set-up and procedures for (a) control experiments without treatment (FM; represented in light yellow), (b) experiments with transferred conditioned medium (CM; represented in pink), (c) experiments with CM plus PARP1 inhibitor (CM + OLA), and (d) experiments with CM plus NF-κB inhibitor (CM + BAY5). The cells involved are irradiated cells (blue) in the IR dish, bystander cells (red) in the IR dish and irradiated cells (green) in the recipient dish.
