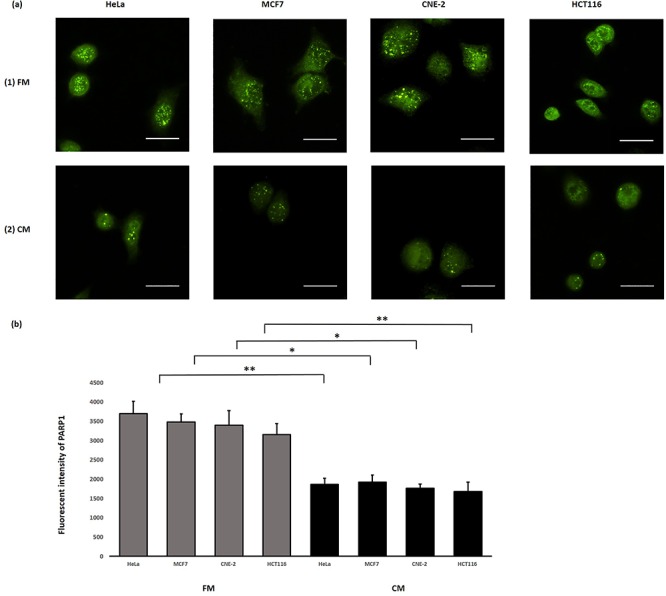
Fig. 7.

(a) Representative images from immunofluorescence staining with anti-PARP1 antibody in HeLa, MCF7, CNE-2 and HCT116 cells after X-ray irradiation. IRCs were treated with (1) FM and (2) CM, for 11.5 h (i.e. until 12 h post-irradiation) and immunofluorescent staining was performed. Scale bar = 25 μm. (b) Fluorescent intensities of PARP1 obtained after treatments with FM and CM in HeLa, MCF7, CNE-2 and HCT116 cells. Data were analysed using Student’s t-test: two-sample assuming unequal variances following one-way ANOVA. *P < 0.05, **P < 0.01 and error bars represent ± SD.
