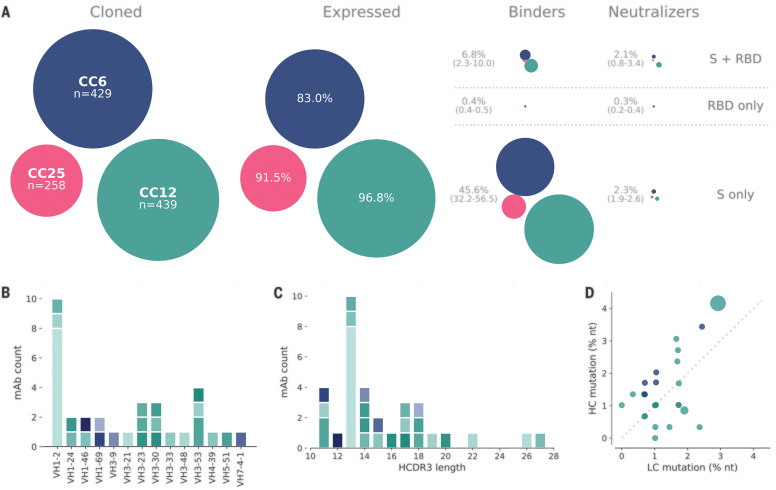
Fig. 3. Antibody isolation and functional screening for SARS-CoV antigen binding and neutralization.
(A) Antibody down-selection process from three donors, presented as bubble plots. The areas of the bubbles for each donor are sized according to the number of antibodies (n) that were cloned and transfected, then scaled according to the number that were positive in subsequent assays. All antibodies that expressed at measurable levels were tested for binding to S protein and RBD to determine their specificity and then screened for neutralization. (B) VH gene distribution of down-selected mAbs. (C) Heavy chain CDR3 lengths of down-selected mAbs. Antibodies in (B) and (C) are colored according to their respective clonal lineages. (D) Mutation frequency of down-selected mAb lineages. Bubble position represents the mean mutation frequency for each lineage, with a bubble area that is proportional to lineage size. LC, light chain; nt, nucleotides.

