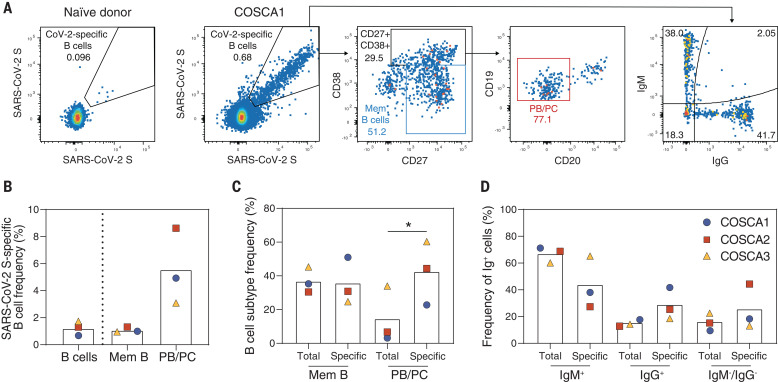
Fig. 2. Characterization of SARS-CoV-2 S protein–specific B cells derived from COSCA1, COSCA2, and COSCA3.
(A) Representative gates of SARS-CoV-2 S protein–specific B cells shown for a naïve donor (left panel) or COSCA1 (middle left panel). Each dot represents a B cell. The gating strategy to identify B cells is shown in fig. S2. From the total pool of SARS-CoV-2 S protein–specific B cells, CD27+CD38– memory B cells (Mem B cells; blue gate) and CD27+CD38+ B cells were identified (middle panel). From the latter gate, PBs/PCs (CD20–; red gate) could be identified (middle right panel). SARS-CoV-2 S protein–specific B cells were also analyzed for their IgG or IgM isotype (right panel). (B) Frequency of SARS-CoV-2 S protein–specific B cells in total B cells, Mem B cells, and PBs/PCs. Symbols represent individual patients, as shown in (D). (C) Comparison of the frequency of Mem B cells (CD27+CD38–) and PB/PC cells (CD27+CD38+CD20–) between the specific (SARS-CoV2 S++) and nonspecific B cells (gating strategy is shown in fig. S2). Symbols represent individual patients, as shown in (D). Statistical differences between two groups were determined using paired t test (*P = 0.034). (D) Comparison of the frequency of IgM+, IgG+, and IgM–IgG– B cells in specific and nonspecific compartments. Bars represent means; symbols represent individual patients.

