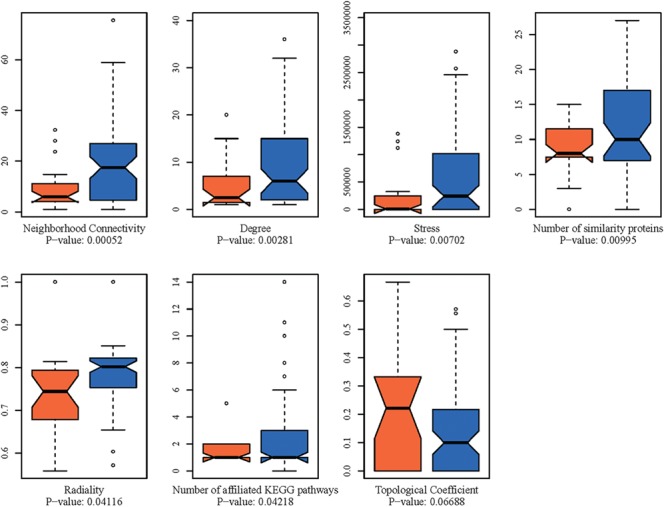
Figure 10.

The box plot comparisons of seven features exhibiting high to moderate levels of variations between the speedy (orange color marked bars) and non-speedy targets (blue color marked bars). The P-values are provided at the bottom of each box plot.
