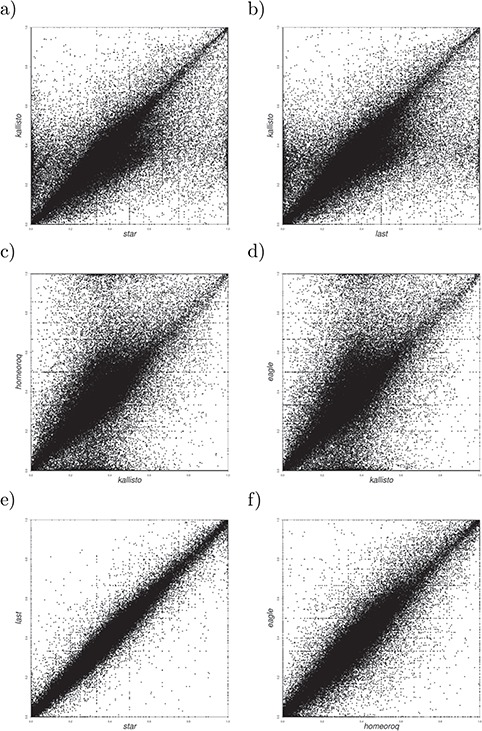
Figure 5.

(a–d) Homeolog expression scatter plots for Kallisto versus other methods in hexaploid wheat, quantified as the expression proportion of subgenome A over the total (A + B + D) per homeolog. (e) Homeolog expression scatter plots for STAR versus LAST. (f) Homeolog expression scatter plots for EAGLE-RC versus HomeoRoq.
