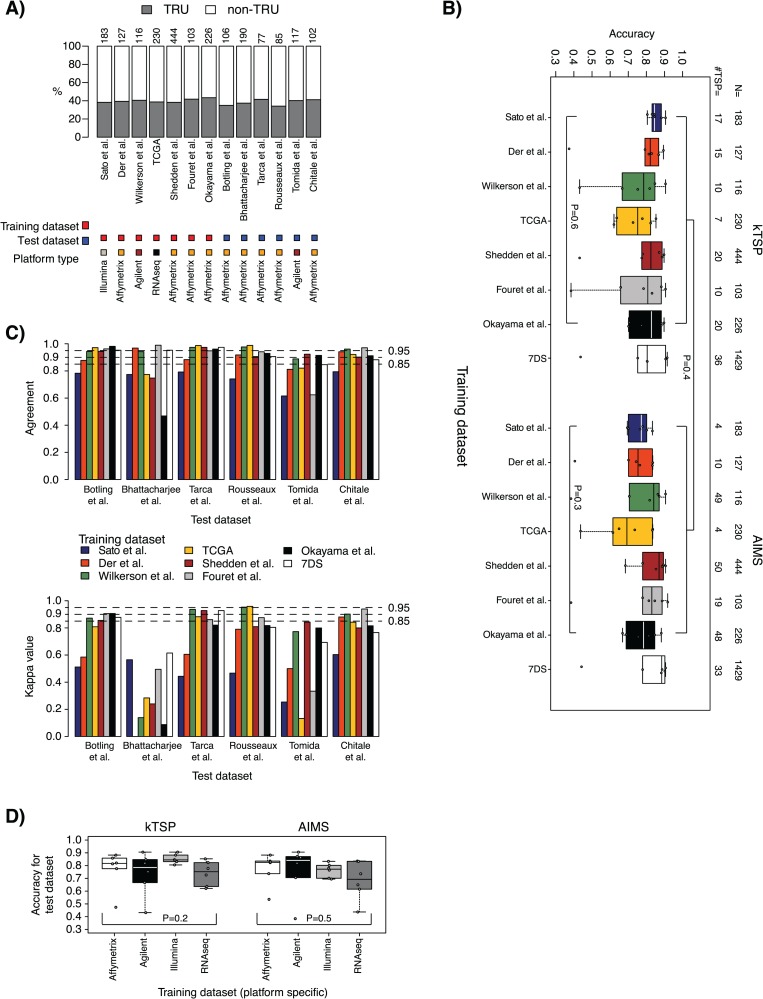
Figure 3.
Molecular subtype case results. (A) Distribution of molecular subtype (representing the endpoint variable) across training and test data sets based on original centroid classification according to Wilkerson et al. [10]. Top axis lists data set sizes. (B) Accuracy results in test data sets for models trained in the seven individual training data sets plus a pooled training data set of all individual data sets (7DS) and applied to the six test data sets for kTSP and AIMS, respectively. (C) Top: agreement in SSP predictions between kTSP and AIMS for the models derived from respective training data sets (individual bars, corresponding to, e.g. the classification agreement of a kTSP model versus AIMS model both developed in the Sato et al. [29] Illumina cohort applied to the Tarca et al. [35] test data set) for each of the six test data sets (group of bars). Agreement is calculated as the proportion of all samples having the same SSP prediction by kTSP and AIMS, irrespective of the basic centroid-based molecular subtype classification. Bottom: corresponding Cohen kappa estimates for the comparison in C. (D) Averaged accuracies for individual test data sets in a platform-wise manner based on training data origin. For classifiers trained on gene expression data run on the same platform, the outcomes (accuracies) across individual test data sets were averaged for kTSP and AIMS, respectively. P-values are calculated using Kruskal–Wallis test for the set of groups defined within the hard brackets. For comparisons between two groups each defined by hard brackets, e.g. in panel B, the Mann–Whitney test was used.

