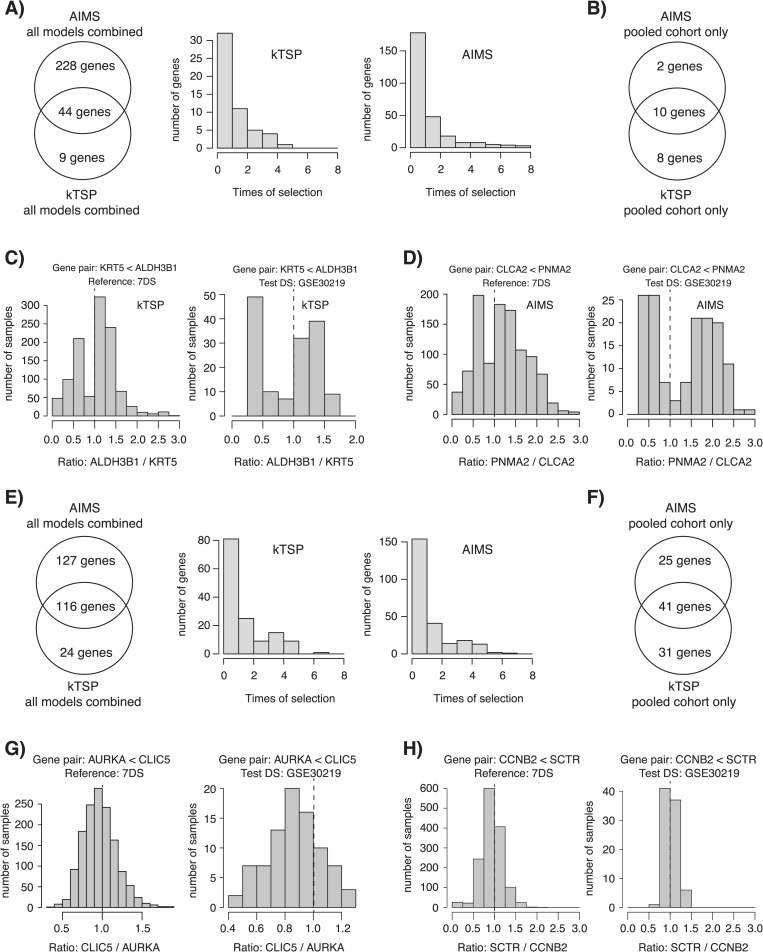
Figure 4.
Characteristics of optimized SSP gene pairs for the histology and molecular subtype cases. (A) Left: Venn diagram of overlap between kTSP and AIMS for all genes identified in any of the created models for the histology case arm. Right: number of times a gene was identified in any of the models created in the histology case arm for kTSP and AIMS, respectively. (B) Specific gene overlap of SSP genes between AIMS and kTSP for the SSP models created from the pooled training data set (7DS) in the histology case arm. (C) Left: gene pair expression ratio for all samples in the pooled training data set (7DS) for one kTSP SSP gene pair (KRT5<ALDH3B1) for the histology model. Right: gene pair expression ratio for the same gene pair in the independent test set GSE30219. In both instances, a bimodal distribution is seen. (D) Similar data as in (C), but now for AIMS for the CLCA2<PNMA2 gene rule. Again, bimodal distributions are seen. (E) Left: Venn diagram of overlap between kTSP and AIMS for all genes identified in any of the created models for the molecular subtype case arm. Right: number of times a gene was identified in any of the models created in the molecular subtype case arm for kTSP and AIMS, respectively. (F) Specific gene overlap of SSP genes between AIMS and kTSP for the SSP models created from the pooled training data set (7DS) in the molecular subtype case arm. (G) Left: gene pair expression ratio for all samples in the pooled training data set (7DS) for one kTSP SSP gene pair (AURKA<CLIC5) for the molecular subtype model. Right: gene pair expression ratio for the same pair in the independent test set GSE30219. In both instances, a unimodal distribution is seen. (H) Similar data as in (G), but now for AIMS for the CCNB2<SCTR gene rule. Again, unimodal distributions are seen.

