. 2019 Jan 30;21(2):458–472. doi: 10.1093/bib/bbz007
© The Author(s) 2019. Published by Oxford University Press.
This is an Open Access article distributed under the terms of the Creative Commons Attribution Non-Commercial License (http://creativecommons.org/licenses/by-nc/4.0/), which permits non-commercial re-use, distribution, and reproduction in any medium, provided the original work is properly cited. For commercial re-use, please contact journals.permissions@oup.com
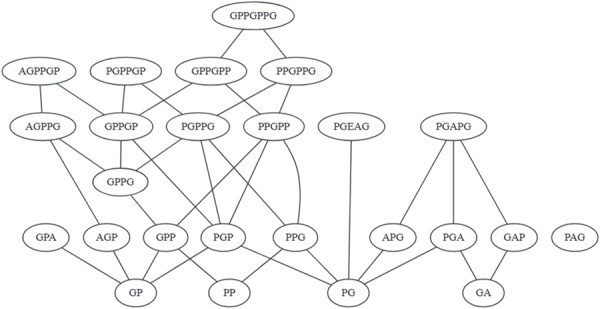
Figure 3.

Motif graph based on SIMPLE analysis of CO1A1_HUMAN.
