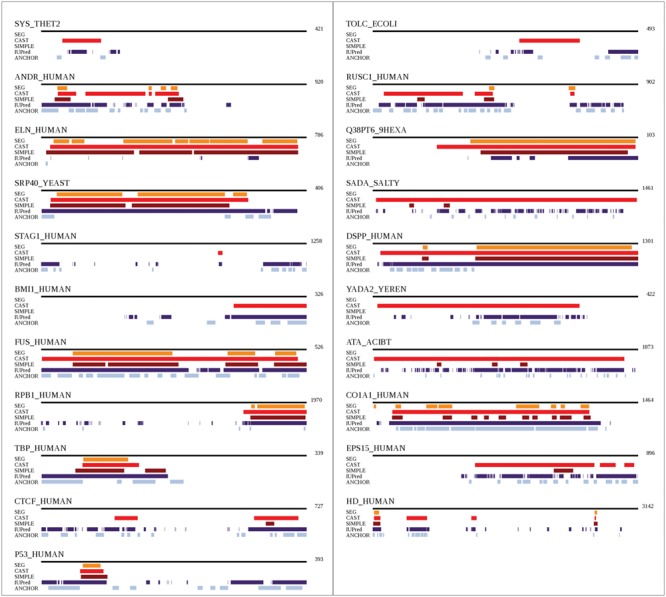
Figure 4.

Comparison of positions detected to be of LC in the 21 proteins of our dataset. Methods SEG (in orange), CAST (in red), SIMPLE (in brown) and IUPred (in purple) were used. ANCHOR (in light blue), which includes structural aspects, is also compared.
