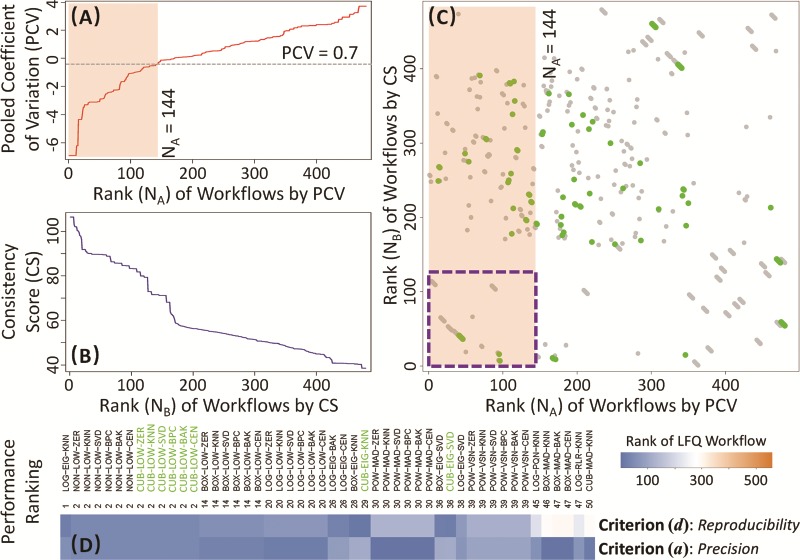
Figure 2.

Performance assessment of LFQ workflows with the benchmark microbiome data set (PXD006224 [42]) from multiple perspectives. (A) precisions of different LFQ workflows were assessed by PCVs. Cut-off (≤0.7) for ‘desired’ PCVs [121] resulted in 144 workflows of good performance (in light orange background). (B) reproducibility of various workflows was evaluated by the CSs. (C) performance of workflows was collectively assessed by both PCVs and ‘CSs’. The dots indicate the rank of each LFQ workflow, as evaluated by PCVs and ‘CSs’, with the possible workflow used in Tilocca’s pioneering study [42] shown as green dots. The dots accumulated within the purple dash line square were considered as the well-performing workflows under both criteria (a) precision and (d) reproducibility. (D) the top 50 overall ranked workflows by both criteria together with their ranks by each independent criterion.
