
Figure 3.
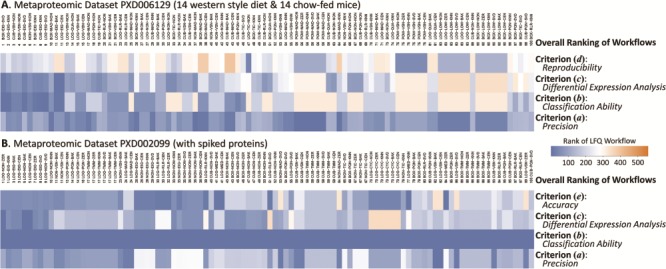
Overall ranking of the performances of LFQ workflows on the metaproteomic data sets (A) PXD006129 with 14 western style diet and 14 chow-fed mice and (B) PXD002099 containing 48 UPS1 proteins spiked with five different concentrations. Since there is no spiked protein in data set PXD006129, only four criteria (a), (b), (c) and (d) were collectively assessed. Since the sample sizes of both case and control in PXD002099 were very small (3 versus 3), it was inappropriate to assess the quantification performance base on criterion (d) reproducibility, and only four criteria (a), (b), (c) and (e) were considered. The performance ranking under each criterion was represented by colored rectangles (the top-ranked LFQ was colored by exact blue). With the increase of ranking number, the color changed gradually toward orange with the last-ranked LFQ shown in exact orange.