
Figure 4.
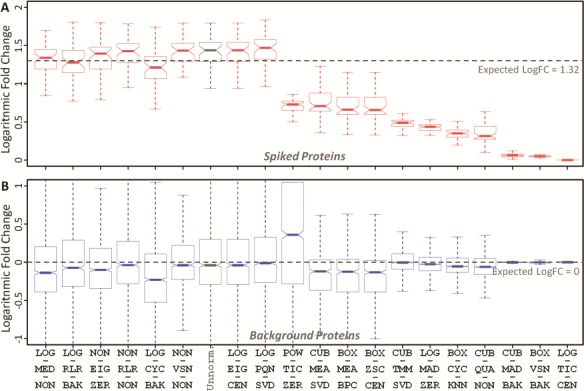
The accuracy of 20 representative LFQ workflows based on (A) spiked and (B) background proteins for two distinct data sets of different protein concentration (10 versus 25 fmol/μL) in PXD002099. The workflows were ordered by the level of deviations between the median and expected logFCs of spiked proteins. Expected logFCs for the background and spiked proteins were 0 and 1.32, respectively. The workflow abbreviation was provided in Table 2. ‘Unnorm.’ denotes unnormalized data.