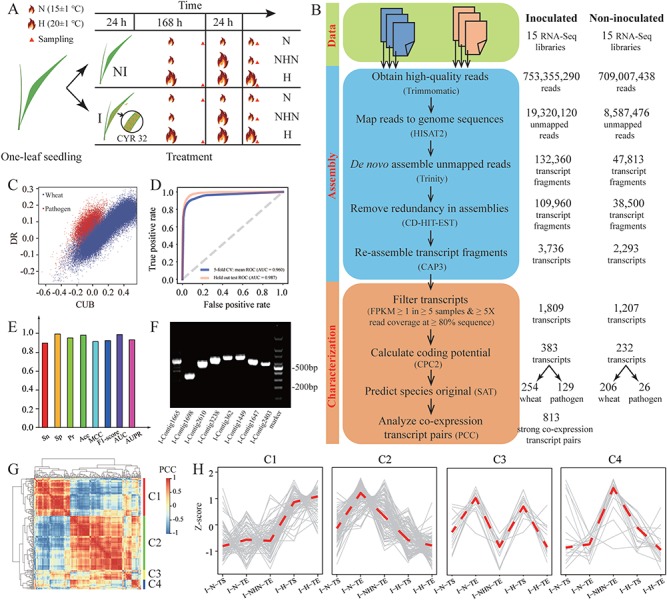
Figure 3.

Application of CAFU to unmapped RNA-Seq reads from stripe rust-infected and uninfected wheat samples. (A) shows the experimental process of obtaining 30 RNA-Seq data from wheat seedlings under different inoculation and temperature treatments. (B) Data mining of unmapped RNA-Seq reads for identifying wheat and pathogen transcripts. (C) Dot plot of CUB and DR; blue and red dots denote wheat and pathogen mRNAs, respectively. (D) ROC curves of 5-fold cross-validation for SAT functional module. The diagonal line is a reference representing 0.5 AUC. (E) Performance evaluation of SAT using hold-out testing samples. (F) PCR amplification of four predicted wheat transcripts (I-Contig1665, I-Contig1698, I-Contig2610 and I-Contig3238) and four predicted pathogen transcripts (I-Contig362, I-Contig1449, I-Contig1647 and I-Contig2403). cDNAs for the PCR amplification of wheat and pathogen transcripts were prepared from XY 6 wheat seedlings and stripe rust-infected wheat seedlings, respectively. (G) Heat map of Pearson’s correlations between 216 assembled transcripts. (H) Expression patterns of assembled transcripts in four clusters. Gray lines represent Z-score-normalized expression levels of all transcripts in the corresponding cluster, and red lines represent the median value of normalized expression levels.
