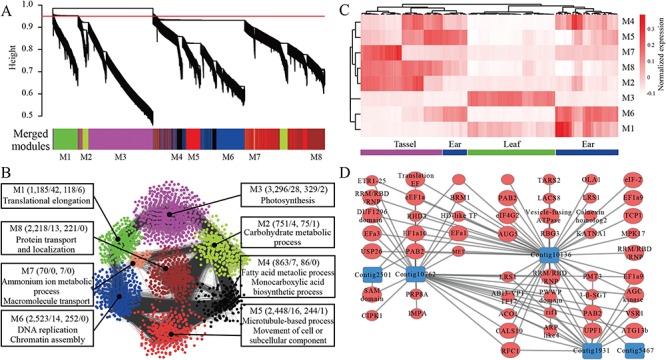
Figure 5.

Functional characterization of differentially expressed transcripts. (A) Hierarchical cluster tree showing co-expression modules identified using weighted gene co-expression network analysis. (B) GO enrichments of eight modules in the co-expression network. (C) shows the expression heat map of transcripts in different modules. (D) Subnetwork showing connections between newly assembled transcripts and reference transcripts encoding translation-related proteins. The subnetwork was constructed using 58 transcripts with top-100 highest correlation coefficients.
