
Figure 4.
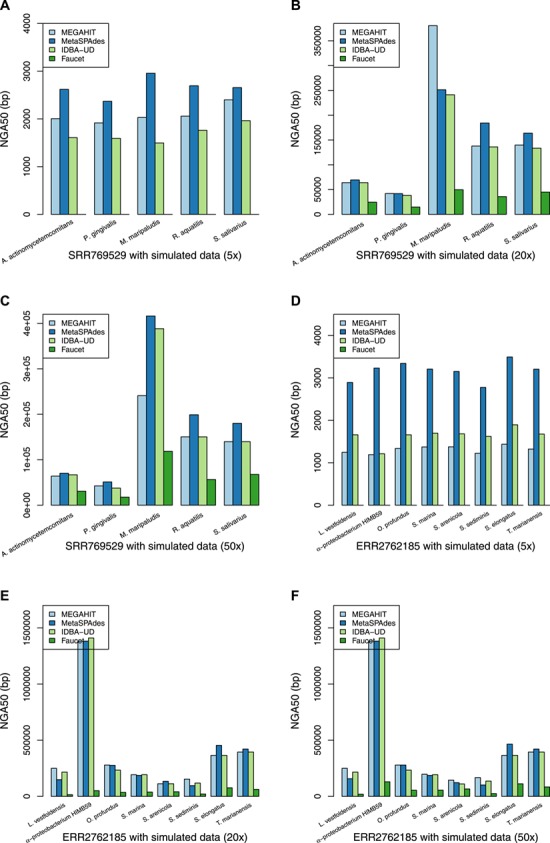
The NGA50 statistics of the assembly for the individual genomes based on different combinations of sequencing coverage and real metagenome datasets. (A) The NGA50 statistics of the mixture of the SRR769529 dataset and the simulation (5x). (B) The NGA50 statistics of the mixture of the SRR769529 dataset and the simulation (20x). (C) The NGA50 statistics for the individual genomes of the assembly of the mixture of the SRR769529 dataset and the simulation (50x). (D) The NGA50 statistics of the mixture of the ERR2762185 dataset and the simulation (5x). (E) The NGA50 statistics of the mixture of the ERR2762185 dataset and the simulation (20x). (F) The NGA50 statistics for the individual genomes of the assembly of the mixture of the ERR2762185 dataset and the simulation (50x).