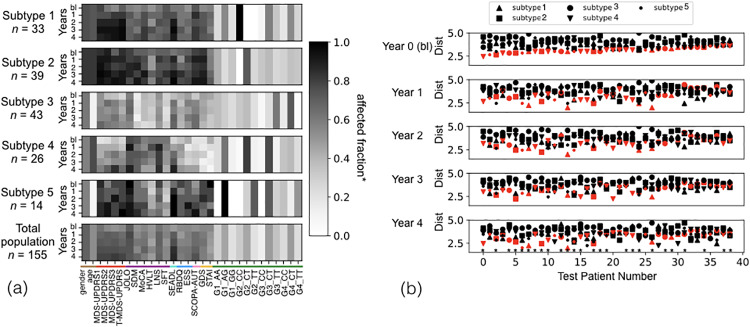
Fig 5. Variable profiles and test patient subtype prediction using clinical and genetic data.
(a) Top five panels show five average community (subtype) profiles, identified by our TPC algorithm. The bottom panel shows the total population profile. The legend is a measure of the affected fraction, i.e, fraction above baseline median in the direction of disease progression for the continuous variables, and fraction that is male and fraction containing the genetic SNP for gender and genetic variables respectively. n is the number of patients in the community. (b) The mth panel shows the distance between the test patient mth year profile and the mth year profile of the subtypes (shape coded). The predicted subtype for each individual (subtype with minimum baseline distance) is colored red to allow for tracking across the years (panels). Prediction accuracy in year 4 is 67%. Patients whose year 4 subtype is correctly predicted from their baseline data are designed by a star. Data includes 39 test patients and 18 clinical variables across 5 time points: baseline (bl) or year 0 + years 1,2,3,4.

