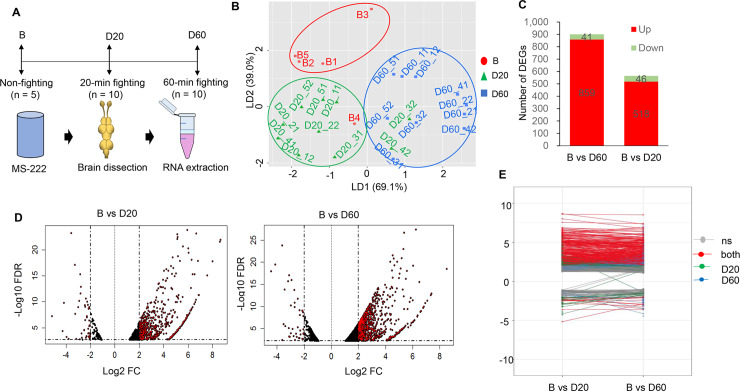
Fig 2. Brain-transcriptomic response.
(A) Overview of experimental design. (B) Clustering of all 25 brain samples using the linear discriminant function analysis (LDA); blue, non-fighting group (B); red, D20 group; and green, D60 group. (C) Bar graph showing the number of DEGs generated from the comparisons of B vs. D60 and B vs. D20. Significantly upregulated and downregulated DEGs are represented in red and green, respectively. (D) Volcano plot of the DEGs obtained from the B vs. D20 and B vs. D60 comparisons. Vertical lines indicate the threshold for a relative expression fold change (FC) of 2 or −2 as compared with controls (B). The horizontal line represents the threshold of a 0.05 FDR value. The red points were significantly upregulated or downregulated in B vs. D20 and B vs. D60. (E) A plot in which the D20 DEGs are projected onto the D60 DEGs and vice versa; ‘ns’ means not significant, ‘both’ means significant in both D20 and D60 groups. Blue, significant only in the D20; green, significant only in the D60.

