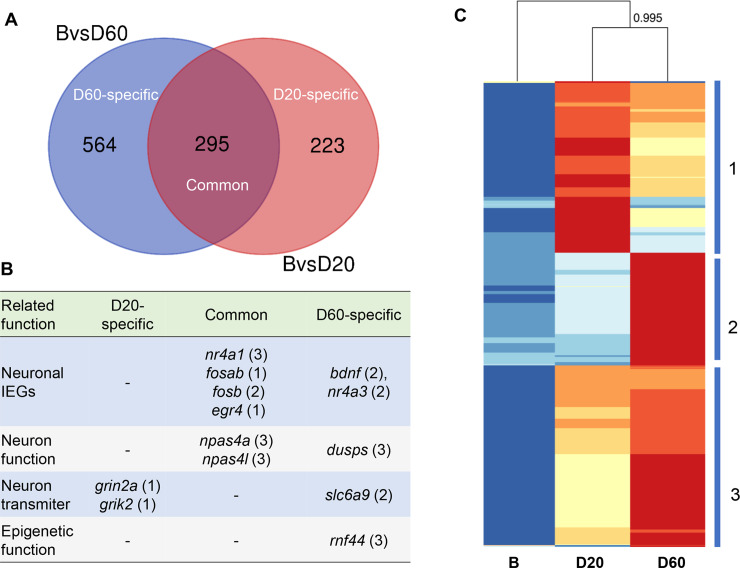
Fig 3. Characterization of DEGs.
(A) Venn diagram displaying the number of common and specific DEGs identified in the B (non-fighting group) vs. D60 and B vs. D20 comparisons. (B) Representative genes among the DEGs that are related to neuronal functions; the numbers in the parentheses indicate which clusters in the heatmap these genes belong to; hyphen ‘-’ means not found. (C) Heatmap using all 1,082 DEGs illustrates four main patterns of gene expression within each of the three groups (B, D20, and D60). Similarities between the fighting groups as shown by hierarchical clustering can be seen above the heatmap. The bootstrap value at the node was obtained by the hclust function in R. Intensity of color indicates expression levels: red, high expression; blue, low expression. The numbers (1−3) on the right side refer to the three main patterns of gene expression.

