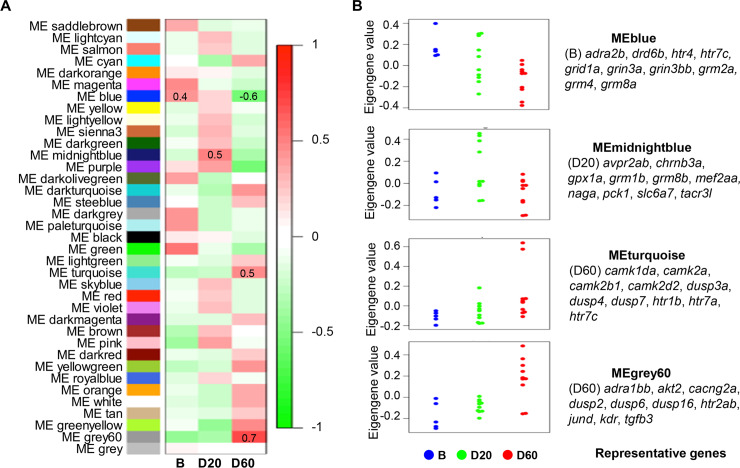
Fig 4. Co-expression gene modules for different fighting groups (B, D20, and D60).
(A) Associations between patterns of expression in the 37 identified modules across all three groups (B, D20, and D60). The colors of the boxes are scaled with the value of the correlation coefficients, ranging from red (r = −1) to green (r = 1). (B) Eigengene values of samples separated by group (B, D20, and D60) for gene modules significantly associated with four groups (blue, midnight blue, turquoise, and grey60). Representative genes enriched in each module are shown.

