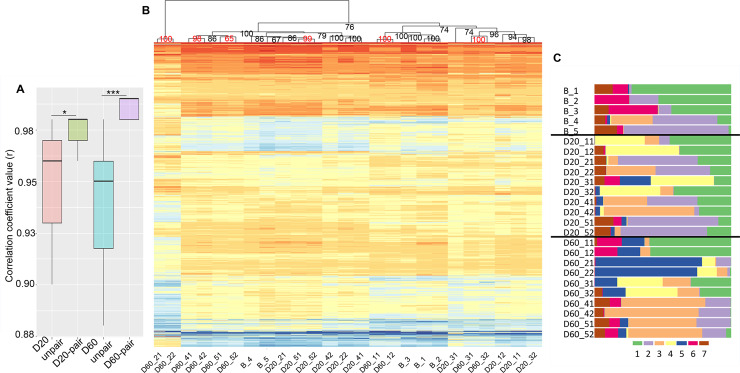
Fig 5. The structure of brain-transcriptomic synchronization.
(A) Boxplot of correlation coefficient values (r) for comparisons of the TMMs for 23,306 gene transcripts between paired fish and unpaired fish from the same treatments (D20-paired vs. D20-unpaired and D60-paired vs. D60-unpaired, permutation test). *p < 0.05; ***p < 0.001. (B) Heatmap using the 25 cDNA libraries with each of the 2,330 gene contigs (top 10% most variable genes). Intensity of color indicates expression level (dark orange, high expression; sky blue, low expression). Similarities between individuals within fighting pairs and between fighting pairs as shown by hierarchical clustering can be seen above the heatmap. Bootstrap values at the nodes were obtained by hclust function in R. Bootstrap values in red indicate the two opponents in a pair were clustered together. (C) GoM analysis using TMM values of all 23,306 genes generated from the 25 libraries with a set of seven clusters represented by different colors.

