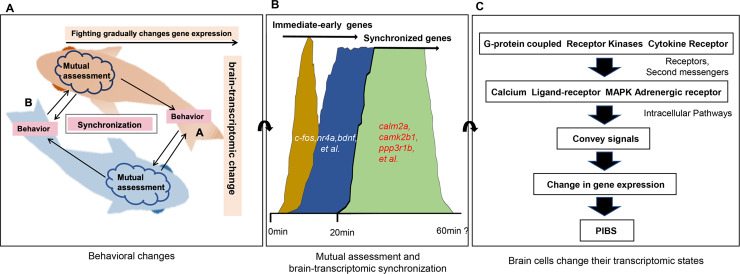
Fig 7. A model for behavioral and brain-transcriptomic synchronization.
(A) Two fish, A and B, initiate aggressive behaviors (opercular display, fin spread, bite/strike). The repeated attempts of each fighting opponent to match the actions of the other opponent lead to behavioral synchronization. (B) Continued physical interaction provides repeated signals for the brains of each fish to adjust the expression of genes in the neurocircuits as mediated by mutual assessment; these genes include immediate-early genes (IEGs), synchronized genes, and learning/memory-associated genes, gradually leading to brain-transcriptomic synchronization. From 0 min to 20 min, different colors are used to refer to transcriptomic plasticity and to partially reflect the gene expression patterns of the DEGs in groups 1 & 2 in Fig 3. From 20 min to 60 min, a single color was used to represent transcriptomic synchronization and to partially reflect the gene expression patterns of the DEGs in groups 3 in Fig 3. (C) Learned association through mutual assessment leads to changes in the physiology of the neurocircuits as mediated by second messengers and intracellular signaling pathways to convey signals for brain-transcriptomic synchronization.

