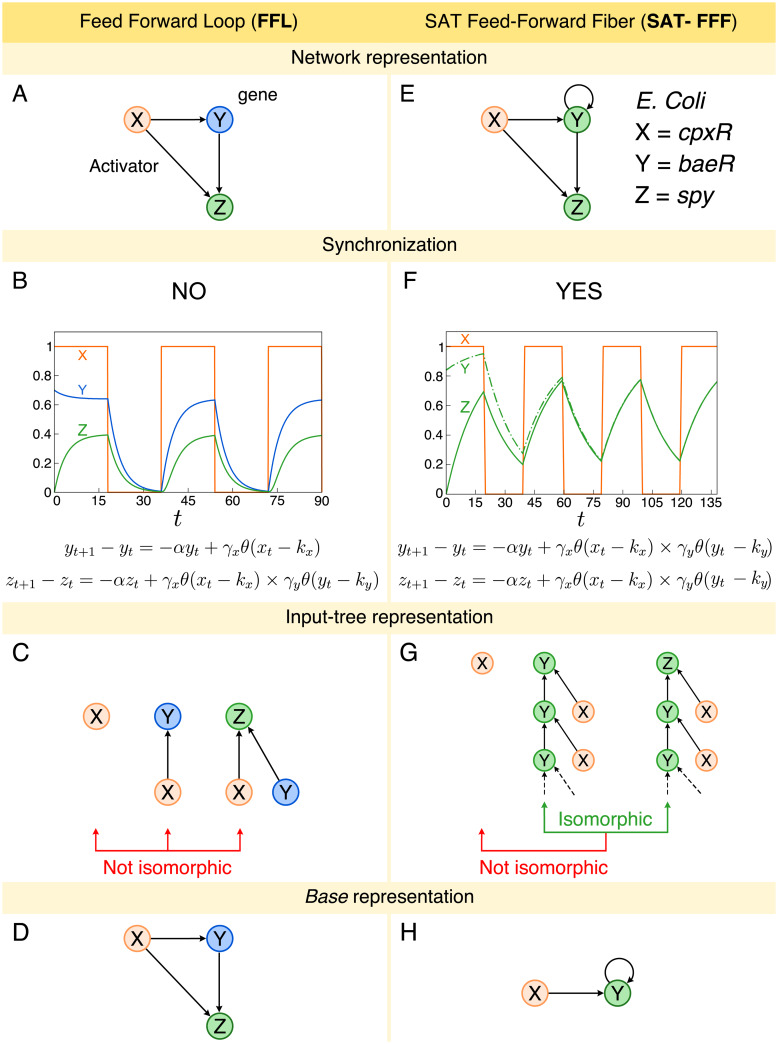
Fig 1. Feed-Forward Loop (FFL) and Feed-Forward Fiber (FFF).
A: FFL network representation. B: Numerical solution of FFL dynamics. The expression levels of genes Y and Z do not synchronize. The oscillation pattern presented is due to the square-wave behavior of gene X expression levels. We use α = 2.0, γx = 0.12, γy = 0.7, kx = 0.5, ky = 0.1, y0 = 0.7 and z0 = 0.0. C: Input tree representation of FFL. The input trees of genes X, Y, and Z are not isomorphic, as a consequence, their expression levels do not synchronize. D: Base representation of FFL. The base is the same as the original circuits since there are no symmetries. E: SAT-FFF network representation. As an example, we consider genes cpxR = X, baeR = Y, and spy = Z from the gene regulatory network of E. coli. The addition of the autoregulation leads to a symmetry between the expression levels of genes Y and Z. F: The numerical solution of the SAT-FFF dynamics shows the synchronization of the expression levels of genes Y and Z. We use α = 0.06, γx = 0.775, γy = 0.775, kx = 0.5, ky = 0.1, y0 = 0.85 and z0 = 0.0. Again, the oscillation is due to the wave-like pattern of X. G: As a result, genes Y and Z have isomorphic input trees. However, the input tree of the external regulator cpxR is not isomorphic, despite the fact that it directly regulates the fiber. H: Since Y and Z synchronize, gene Z can be collapsed into Y, resulting in a simpler base representation.

