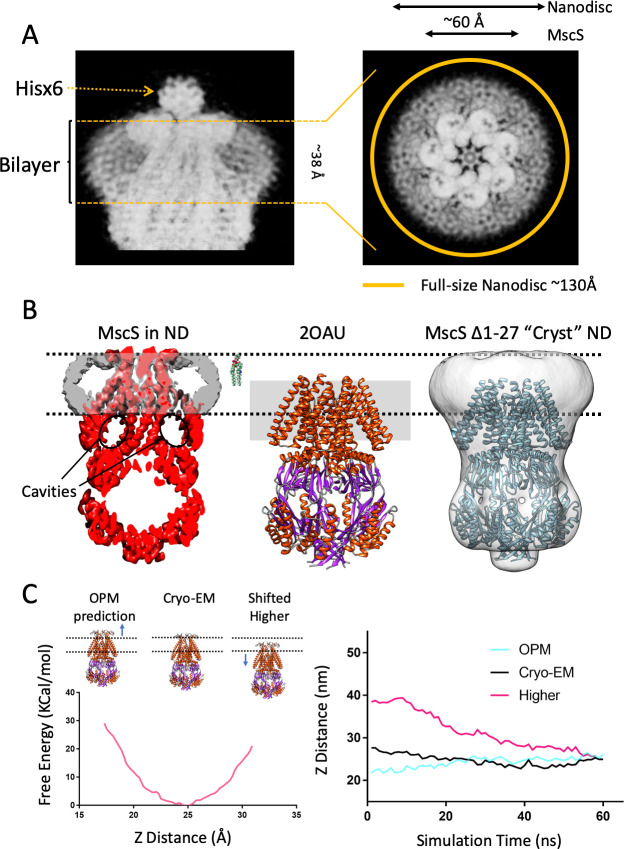
Figure 2. A new lipid-protein interface for membrane-embedded MscS.
(A) Close-up of MscS-ND EM density (in Chimera’s ‘solid’ representation). Left, Side view. The location of the bilayer in the nanodisc in indicated by dashed yellow likes (approximately 38 Å in diameter). Density for the putative heptameric histidine tag complex is shown by a dotted arrow. Right, Top view. The yellow circle represents the putative average size of the E3D1 nanodisc (~130 Å) in relation to the density, which points to a partial averaging of the density likely due to MscS lateral mobility. (B) Comparison between the location of the membrane interface in MscS-ND, the FC14 crystal structure (2OAU) and the ‘Cryst’ deletion construct. Black dashed lines depict the limits of the lipid bilayer based on the nanodisc EM density. Left, EM density for the protein (red) and the nanodisc (grey) for MscS-ND, the black ovals highlight the fact that the prominent cavities formed between the TM1-TM2 hairpin and TM3 are fully located outside the membrane. Center, relative positioning of 2OAU based on a rigid fit of the structure onto MscS-ND EM density. The gray rectangle in the background represents the previous consensus membrane location. Right, the low-resolution cryoEM structure of MscS ∆2–27 (‘Cryst’,~20 Å) shows an overall architecture for the nanodisc-embedded channel. In spite of the N-terminal deletion, the nanodisc is located at the same position as in MscS-ND. (C) Probing the energetics of the membrane interface. A Potential of mean force (PMF) calculation was carried out by relocating a lipid bilayer from a coordinate origin (0 Å) predicted by the CHARM-GUI server (Jo et al., 2008) and moved up to 16 Å (the thickness of a lipid monolayer) along the Z-axis coordinate (see Figure 2—figure supplement 2). Left, free energy as a function of Z-axis displacement. A global minima was found at ~25 Å (~8 Å above the prediction) and the free energy increases exponentially beyond this point. The energy minima coincides with the location if the interface as defined by the EM density of MscS-ND. Right, evolution of MD simulation starting at three membrane interface locations: predicted by CHARM-GUI (0 Å, red trace), at the cryo-EM density (+ 8 Å, black trace) and a further +16 Å (Higher placement, blue trace). After ~60 ns simulation all membrane interfaces converge to that defined by the cryo-EM density.
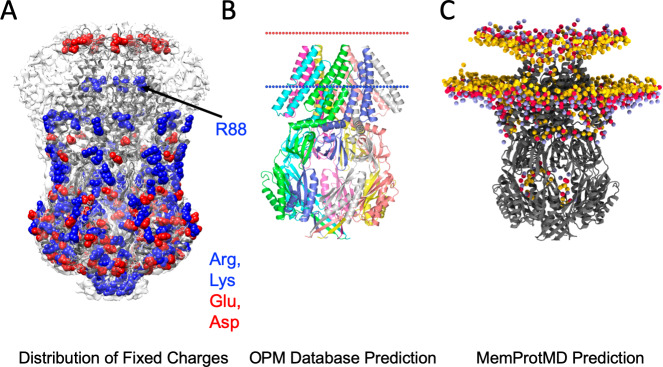
Figure 2—figure supplement 1. MscS bilayer footprint is compatible with bilayer predictions and surface charge distribution.
Figure 2—figure supplement 2. Details of MD simulations and PMF calculated from umbrella sampling for determining the optimum position of MscS with respect to the bilayer.
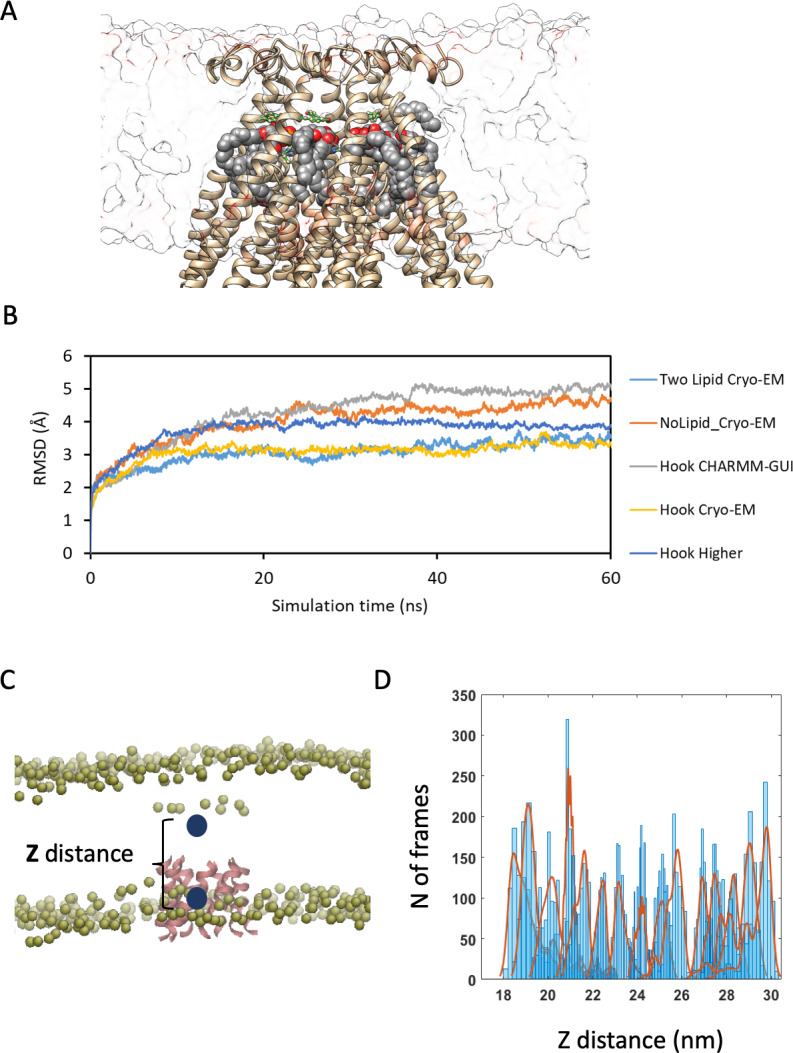
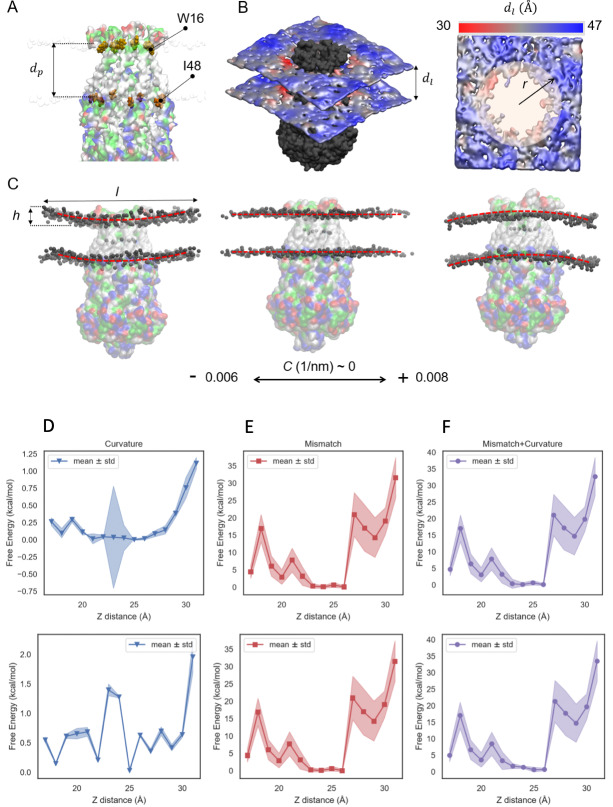
Figure 2—figure supplement 3. Geometrical properties of MscS embedded in a lipid bilayer for PMF calculations.
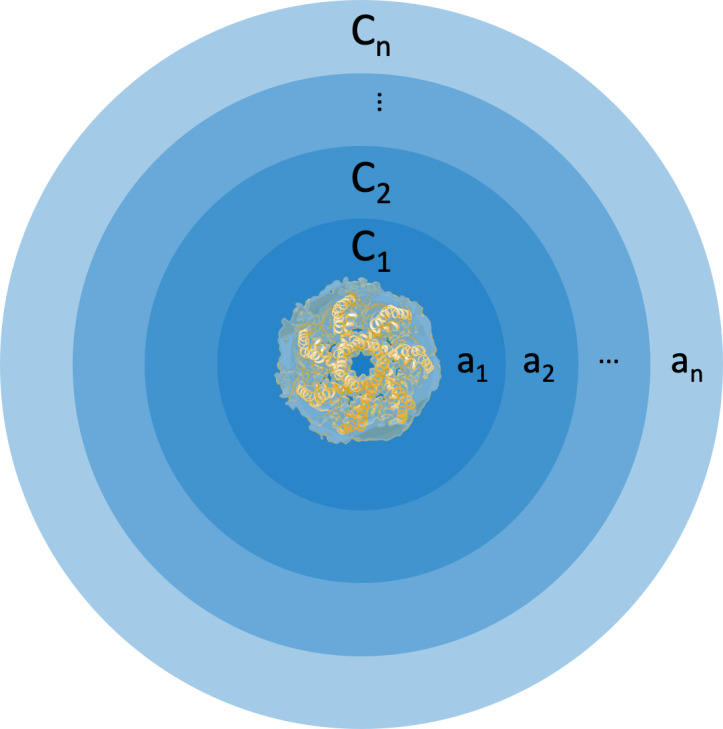
Figure 2—figure supplement 4. Cartoon representation of concentric areas and associated curvatures around membrane-embedded MscS.
