. 2019 Dec 27;8:e50486. doi: 10.7554/eLife.50486

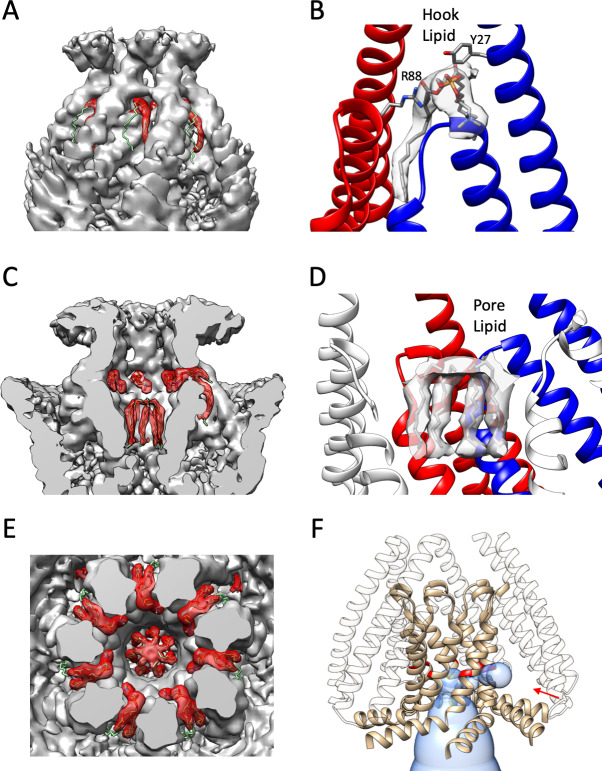
Figure 5. Bound lipid at the inner gate and the permeation pathway.

(A) Side (left) and top (right) views of EM density (transparent red surface) associated with putative lipid molecules bound to MscS-ND (shown in white cartoon representation). A ‘hook’ phospholipid is cradled at the subunit interface atop the TM2-TM3 hairpin, while seven individual acyl chains line the permeation pathway along TM3, above the narrowest portion of the gate. (B) Contact map and coordination of the hook lipid. Left, TM helices from two adjacent subunits (red and blue) are shown. Key interactions are highlighted for R88 (in the red subunit) with the head group nitrogen (PC or PE) and Y27 (in the blue subunit) with the phosphate group. Residues within van der Waals distances are shown in red. Right, a cartoon representation of the contact/coordination map. (C) Same as (B), but with the pore lipid acyl chains.

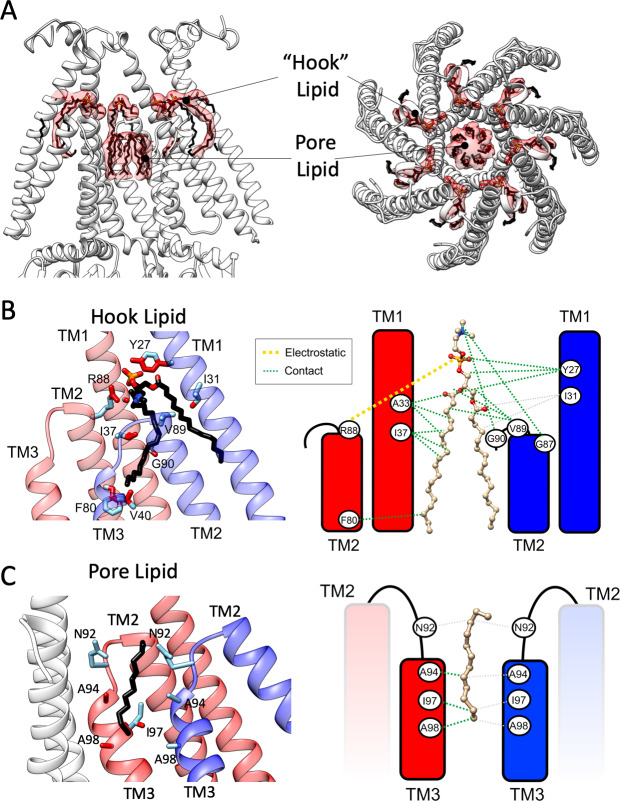
Figure 5.

Figure 5—figure supplement 1. Bound Lipids in MscS.

Figure 5—figure supplement 1.

Close up of the hook lipid density fitted to a POPC molecule and pore lipid density fitted as a hexadecane. (A), Hook lipid density highlighted in red showing the insertion into a cavity formed by two adjacent TM1 helices and the hairpin of TM2-TM3a. One of the acyl chains is presumably partially averaged out due to local dynamics. (B) EM density corresponding to a hook lipid. Coordinating side chains Y27 and R88 (from two adjacent subunits) are shown in stick representation. (C) Overview of the hook and pore lipids in the context of the entire density. (D) Close up of pore lipids in close interaction with the N-terminal end of TM3 and the TM2-TM3 linker. (E) Top view of the lipids in the context of the entire density. (A), (C) and (E) have the lipids and overall density contorted at the same level. (F) Predicted pathway connecting the location of the putative pore lipids in the permeation path with the intracellular TM2/TM3a cavity. Volume predicted by MOLEonline (https://mole.upol.cz) is depicted as a blue transparent envelope. The tan ribbon corresponds to the TM3 a and TM3b helices with G104 colored red along with a red arrow points to the potential connecting gap between G104 residues in adjacent subunits.
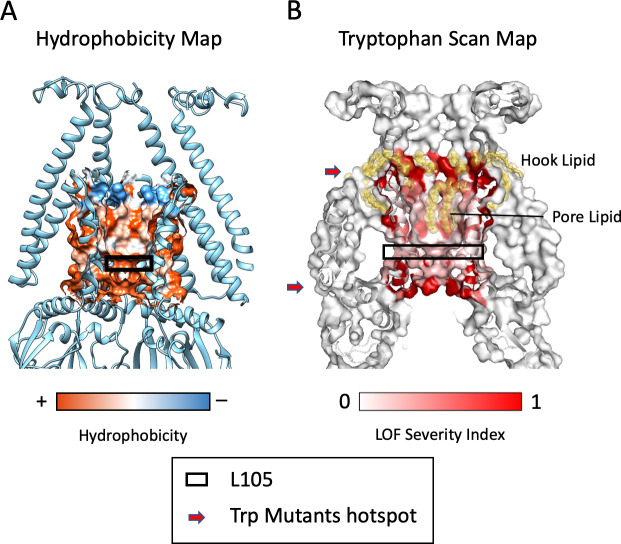
Figure 5—figure supplement 2. Properties of the MscS Permeation Pathway.

Figure 5—figure supplement 2.

(A) Hydrophobicity map of the residues lining the pore (Chimera, Pettersen et al., 2004). Pore lining lipids (Figure 3C) are located in the hydrophobic region just above the L105 ‘gate’ residue (black box). (B) A Tryptophan scan of TM3a (Rasmussen et al., 2015), when mapped onto the ND-MscS structure shows two severe loss of function (LOF) areas (red arrows): A region that includes residues that coordinate the Hook Lipid (top) and a region (bottom arrow) around and below the L105 gate residue (black box).
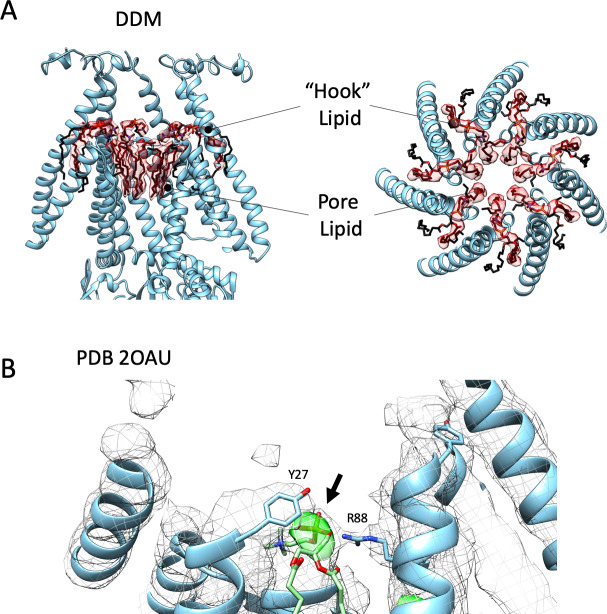
Figure 5—figure supplement 3. Bound Lipids are also found in Detergent-Based Structures.

Figure 5—figure supplement 3.

(A) Lipid density in MscS DDM cryo-EM structure. Like in Figure 3A, Side (left) and top (right) views of EM density (transparent red surface) associated with the putative lipid molecules bound to MscS-ND (shown in white cartoon representation). A ‘hook’ phospholipid is cradled at the subunit interface atop the TM2-TM3 hairpin, while seven individual acyl chains line the permeation pathway along TM3, above the narrowest portion of the gate. (B) Electron density maps of 2OAU, in Foscholine-14. 2Fo-Fc map is a grey mesh while the Fo-Fc map is in green. MscS ND cryo-EM model was aligned to the 2OAU model in cyan. The MscS ND hook lipid (POPC), in green, the phosphate group is within the green density. Despite the crystal structure not having any explicit lipids, this density would correspond to the highest electron-dense chemical group in the crystal (Phosphate). Residues Y27 and R88 are precisely positioned to coordinate this density in an equivalent way as the hook lipid in ND-MscS (Figure 3—figure supplement 3A).