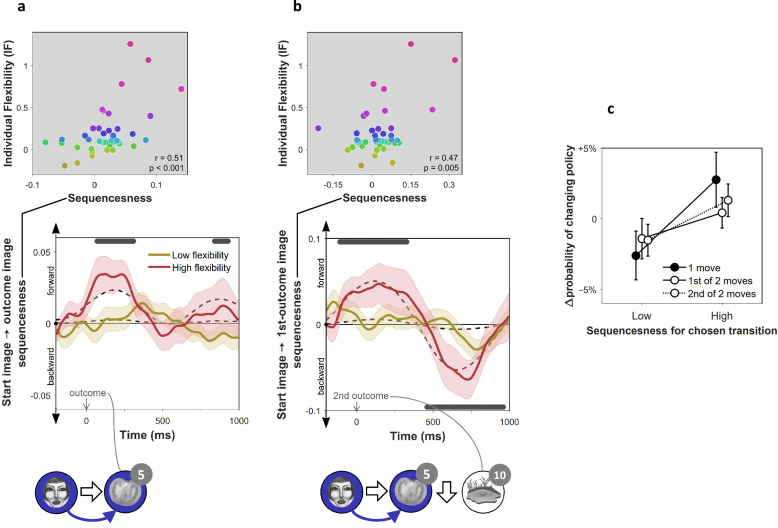
Figure 3. On-task replay of state-to-state trajectories as a function of individual flexibility.
= 40 subjects. (a) Sequenceness corresponding to a transition from the image the subject had just left (‘Start image’; in the cartoon at the bottom, the face) to the image to which they arrived (‘outcome image’; the tomato) following highly surprising outcomes (i.e., above-mean state prediction error). In the cartoon, the white arrow indicates the actual action taken on the trial; the blue arrow indicates the sequence that is being decoded. For display purposes alone, mean time series are shown separately for subjects with high (above median) and low (below median) IF. Positive sequenceness values indicate forward replay and negative values indicate backward replay. As in previous work (Eldar et al., 2018), sequenceness was averaged over all inter-image time lags from 10 ms to 200 ms, and each timepoint reflects a moving time window of 600 ms centred at the given time (e.g., the 1 s timepoint reflects MEG data from 0.7 s to 1.3 s following outcome). Dashed lines show mean data generated by a Bayesian Gaussian Process analysis, and the dark gray bars indicate timepoints where the 95% Credible Interval excludes zero and Cohen’s d > 0.1. The top plot shows IF as a function of sequenceness for the timepoint where the average over all subjects was maximal. value derived using a premutation test. Dot colours denote flexibility rank. (b) Sequenceness following the conclusion of 2-move trials corresponding to a transition from the starting image to the first outcome image. (c) Difference in the probability of subsequently choosing a different transition as a function of sequenceness recorded at the transition’s conclusion. For display purposes only, sequenceness is divided into high (i.e., above mean) and low (i.e., below mean). A correlation analysis between sequenceness and probability of policy change showed a similar relationship (Spearman correlation: , , , Bootstrap test). Sequenceness was averaged over the first cluster of significant timepoints from panels b) and c), in subjects with non-negligible inferred sequenceness (more than the standard deviation divided by 10; ), for the first time the subject chose each trajectory. Probability of changing policy was computed as the frequency of choosing a different move when occupying precisely the same state again. 0 corresponds to the average probability of change (51%). Error bars: s.e.m.

