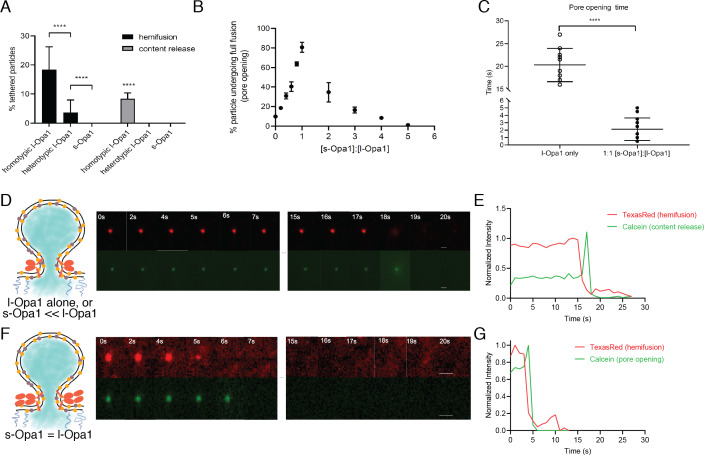
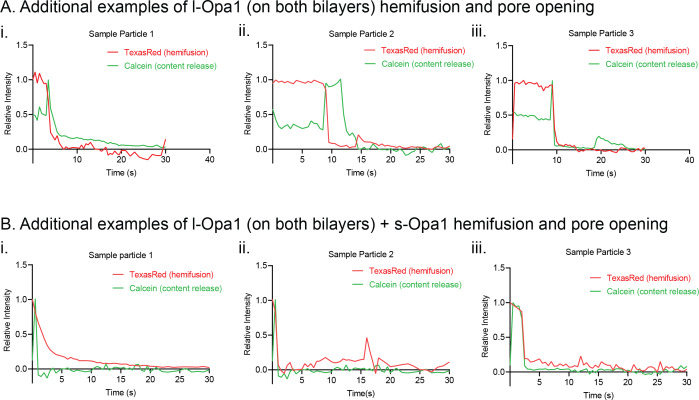
Figure 6. Hemifusion and full fusion.
(A) Hemifusion (lipid mixing) and full fusion (content release and pore opening) efficiency for homotypic l-Opa1, heterotypic l-Opa1 and s-Opa1 (p<0.001, two-way ANOVA). Bar graphs shown as mean ± SD. Error bars are from five different experiments (50–200 particles were analyzed per bilayer in each experiment). B. Full fusion (pore opening) efficiency at different s-Opa1:l-Opa1 ratios. Data are shown as mean ± SD. Error bars are from 4 to 6 experiments (80–150 particles per bilayer in each experiment). The significance of the data was confirmed using one-way ANOVA (Prism 8.3) where p<0.0001. C. Mean pore opening time in the absence of s-Opa1 and at equimolar s-Opa1. Significance of the difference was confirmed using t-test (Prism 8.3, p<0.0001). D. Representative hemifusion and pore opening fluorescence time series for homotypic l-Opa1 experiment, in the absence of s-Opa1, top and bottom panels, respectively. Scale bar: 1 µm. E: representative traces of TexasRed (liposome signal) and calcein (content signal) intensity for homotypic l-Opa1 experiment. F. Representative hemifusion and pore opening fluorescence traces for a homotypic l-Opa1 experiment in the presence of equimolar s-Opa1. Scale bar: 1 µm. G: Representative trace of TexasRed (liposome signal) and calcein (content signal) intensity for a homotypic l-Opa1 experiment in the presence of equimolar s-Opa1.


