. 2019 Dec 9;8:e48498. doi: 10.7554/eLife.48498

Figure 1. Longevity takes many generations to manifest in wdr-5 mutants.

Analysis of relative lifespan between wild-type (gray) and wdr-5 mutants (purple) across generational time. P0 wild type was descended from animals recovered from a thaw. P0 wdr-5 mutants were the first homozygous mutants after maintenance as heterozygotes for five generations. For each generation, the x-axis is 40 days. *p<0.05, **p<0.01, ***p<0.001 compared to wild-type from the same generation with log-rank test. Median lifespan and statistics are presented in supplementary file 1. Additional replicates shown in Figure 1—figure supplement 1 and supplementary file 3.

Figure 1.

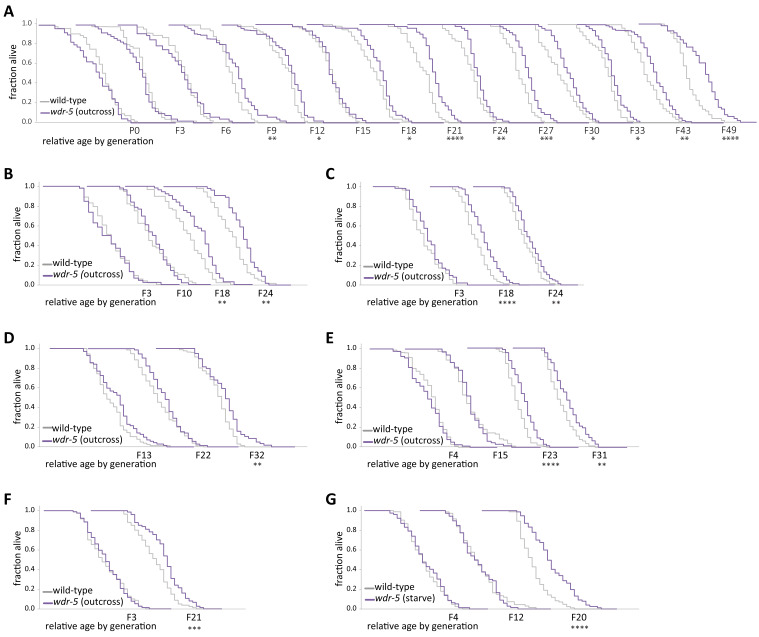
Figure 1—figure supplement 1. Longevity in wdr-5 mutants reproducibly takes many generations to manifest.

Figure 1—figure supplement 1.

(A–G) Analysis of relative lifespan between wild-type (gray) and wdr-5 mutants (purple) in seven independent transgenerational experiments. wdr-5 mutant populations were either reset by being maintained as heterozygotes for five generations following an outcross or by starving, as indicated in graph legend. Replicates (E), and (F), along with replicate shown in Figure 1, were used for ChIP-seq analysis. For each generation, the x-axis is 40 days. *p<0.05, **p<0.01, ***p<0.001, and ****p<0.0001 compared to wild-type from the same generation with log-rank test. Mean lifespan and statistics are presented in supplementary file 3.
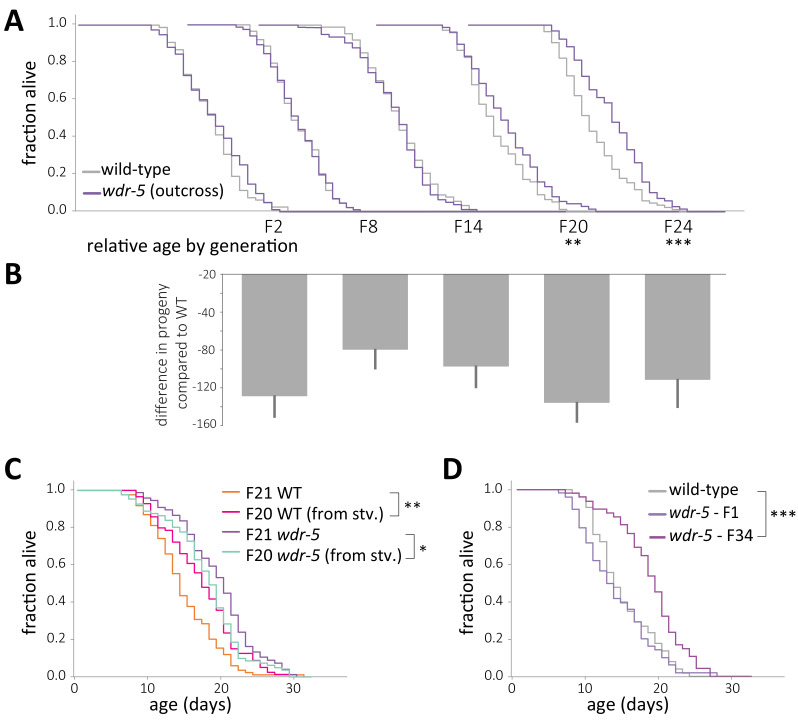
Figure 1—figure supplement 2. Longevity is not caused by decreased fecundity or by background mutations.

Figure 1—figure supplement 2.

(A) Comparison of relative lifespan between wild-type (gray) and wdr-5 mutant (purple) populations over generational time. For each generation, the x-axis is set at is 40 days. (B) Difference in progeny number between wild type and wdr-5 mutants for populations shown in (A). Each generation in (B) is shown directly under the corresponding generation in (A). (C) Comparison of lifespan in fed descendants from starved or fed late-gen populations of either wdr-5 mutants (purple and cyan, respectively) or wild type (orange and pink, respectively). (D) Lifespan of early-gen wdr-5 mutants (purple) derived from outcrossing late-gen wdr-5 mutants compared to the corresponding un-outcrossed late-gen wdr-5 mutant population (plum) and mid-gen wild-type animals (gray). *p<0.06, **p<0.01 and ***p<0.001 compared to the wild-type population in the same assay with log-rank test. Progeny data and an additional replicate are presented in supplementary file 2. Median lifespan, statistics, and additional replicates are presented in supplementary file 3.
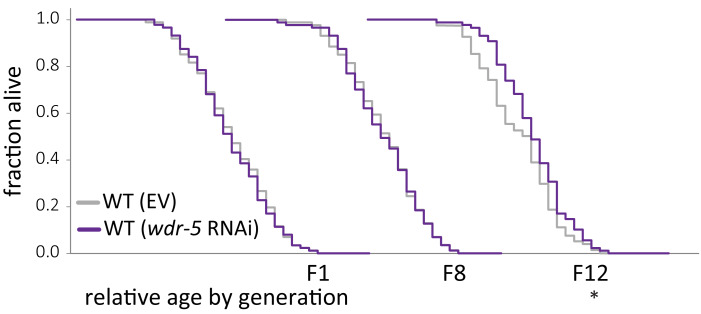
Figure 1—figure supplement 3. Depletion by RNAi does not increase lifespan within twelve generations.

Figure 1—figure supplement 3.

Comparison of relative lifespan between wild-type animals on an empty vector control (gray) and wild-type animals on wdr-5 RNAi (dark purple) populations over generational time. For each generation, the x-axis is set at is 35 days. *p<0.05 compared to the wild-type population fed an empty vector control with log-rank test. Median lifespan and statistics are presented in supplementary file 3.