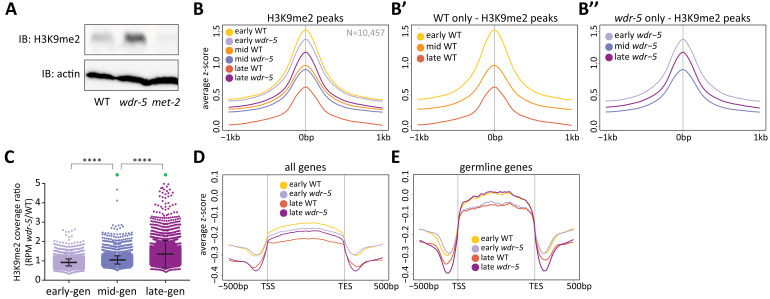
Figure 3. Long-lived wdr-5 mutants have more H3K9me2 enrichment than wild type.
(A) Immunoblot comparing H3K9me2 protein levels in late-gen wild type to late-gen wdr-5 mutants and late-gen met-2 mutants (representative of two independent experiments). Actin is used as a loading control. (B, D, E) Metaplots of averaged z-score H3K9me2 ChIP-seq signal across H3K9me2 peaks (B), all genes (D), or germline genes (E) in early-, mid-, and late-gen populations of wild type (yellow, orange, and red, respectively) and wdr-5 mutants (lavender, purple, and plum, respectively). Line shows mean ChIP-seq signal. Data in (B) are also shown separated into wild type (B’) and wdr-5 mutants (B’’). Plots are centered on peak centers (B, B’, B’’) or pseudoscaled over genes to 1 kb with 500 bp borders on either side, indicated by vertical gray lines (D–E). (C) H3K9me2 ChIP-seq ratios of wdr-5 mutant coverage over wild-type coverage at each H3K9me2 peak (N = 10,457). Coverage is normalized to RPM. Thick line shows mean and whiskers show standard deviation. Green dots represent peaks that fall beyond y-axis scale (two peaks in mid-gen and 33 peaks in late-gen). ****p<0.0001 with paired t-test.


