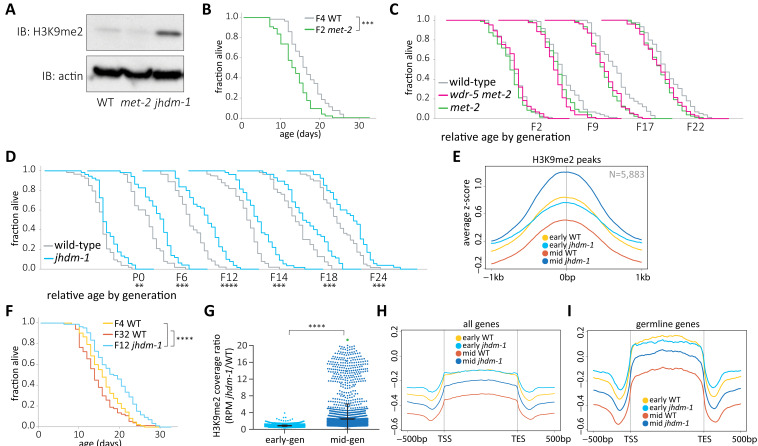
Figure 4. wdr-5 mutant lifespan extension requires H3K9me2.
(A) Immunoblot comparing H3K9me2 protein levels in mid-gen mixed-stage wild type to mid-gen jhdm-1 and mid-gen met-2 mutants (representative of two independent experiments). Actin is used as a loading control. (B, F) Lifespan of early-gen met-2 mutants (green) and wild type (gray) (B) or mid-gen jhdm-1 mutants (blue) compared to early- (yellow) and late-gen (orange) wild type (F). (C–D) Generational analysis comparing relative lifespan in wdr-5 met-2 double mutants (pink) and met-2 single mutants (green) (C) or jhdm-1 mutants (blue) (D) to late-gen wild type (gray). The generation below each assay refers only to mutant populations. For each generation, the x-axis is set at is 40 days. (E, H, I) Metaplots of averaged z-score H3K9me2 ChIP-seq signal across H3K9me2 peaks (E), all genes (H), or germline genes (I) in early- and mid-gen populations of wild type (yellow and orange, respectively) and jhdm-1 mutants (blue and navy, respectively). Line shows mean ChIP-seq signal. Plots are either centered on peak centers (E) or pseudoscaled over genes to 1 kb with 500 bp borders on either side, indicated by vertical gray lines (H– I). (G) H3K9me2 ChIP-seq ratios of jhdm-1 mutant coverage over wild-type coverage at each H3K9me2 peak. Coverage for each sample is normalized to RPM. Thick line shows mean and whiskers show standard deviation. Green dot represents 65 peaks that lie beyond y-axis scale. *p<0.05, **p<0.01, ***p<0.001, and ****p<0.0001 compared to wild-type with log-rank test for lifespan assays or with paired t-test for coverage ratios. Median lifespan and statistics are presented in supplementary file 1, with additional replicates included in supplementary file 3.


