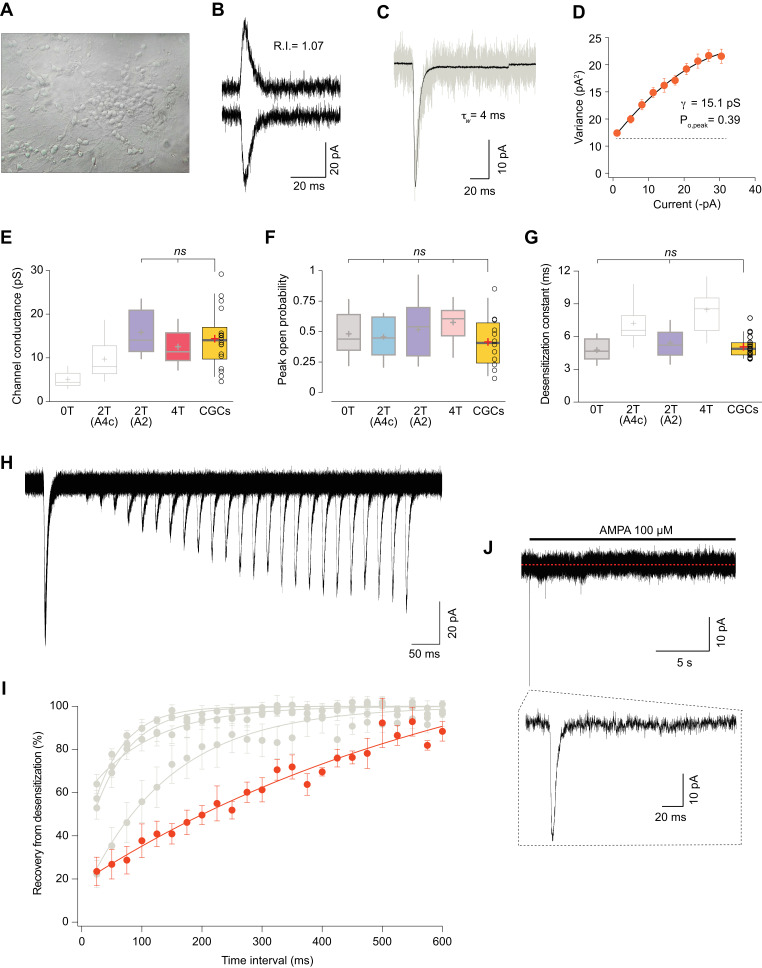
Figure 7. Somatic currents from CGCs exhibit properties of GluA2:γ2 + GluA4c CI-AMPARs.
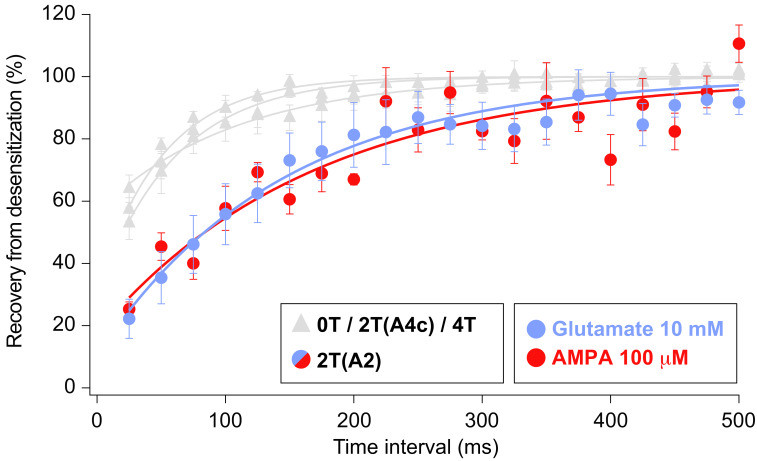
(A) CGCs in culture after 7 days in vitro. (B) Traces at +60 mV and −60 mV evoked with 100 μM AMPA from a CGC somatic patch showing the typical lineal response of a CI-AMPAR. (C) Representative response of current evoked at −60 mV by rapid application of 100 μM AMPA to somatic patches from CGCs. Grey: representative single response; black: average of 275 stable responses. (D) NSFA from the recording in C. (E) Data showing comparison of single channel conductance values obtained in CGCs (orange box) with recordings from transfected cell lines. The conductance values obtained resembled (without significant difference) to the ones seen with 2T(A2) or 4T conditions (marked in bold grey). (F) Comparison of peak open probability values from CGCs were no significant differences from recordings in cell lines was observed. (G) Compared data of desensitization time constant (ms) from CGCs with recordings in tsA201 cells. The results are no significantly different from conditions with 0T or 2T(A2). (H) Representative trace from two-pulse protocol monitoring recovery from desensitization for CGCs somatic patches to 100 μM AMPA application. (I) Recovery from desensitization kinetics of CGS somatic AMPARs compared with recoveries of GluA2:GluA4c combinations shown in Figure 6F (in grey). (J) Representative response to a 100 μM AMPA application for 20 s in a somatic patch from CGCs to test for the presence of γ7. No re-sensitization of the receptors is observed in the trace. Inset: magnification of 200 ms showing the initial fast desensitizing response. The data from this figure containing statistical tests applied, exact sample number, p values and details of replicates are available in ‘Figure 7—source data 1'.


