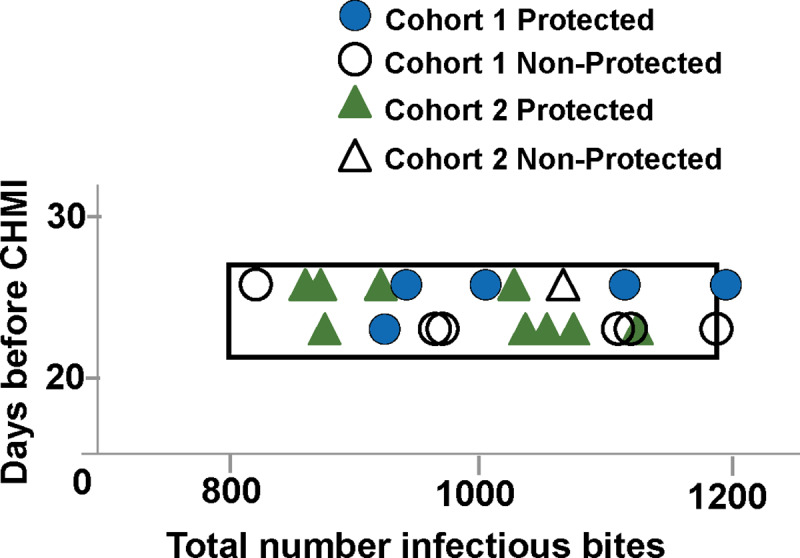
Fig 5. Comparison of total number of infectious bites and time to CHMI in Cohort 1 and Cohort 2 with the target range of infectious bites.

The total number of infectious bites and days between final immunization and CHMI are compared for Cohort 1 (protected: blue circles; non-protected: open circles) and Cohort 2 (protected: green triangles; non-protected: open triangles). All Cohort 1 and Cohort 2 subjects fell within the target box except one protected subject and one non-protected subject in Cohort 1 that fell just outside the target box. The distribution of subjects in Cohort 1 and Cohort 2 showed no association of protection with total numbers of infectious bites or time (days) before CHMI.
