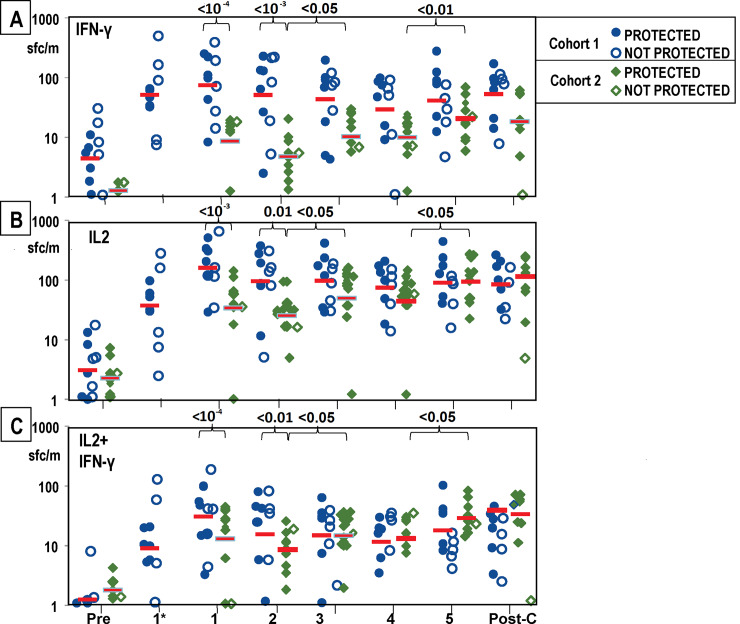
Fig 6. Cohort 1 and Cohort 2: FluoroSpot activities to whole sporozoites after each immunization and CHMI.
FluoroSpot IFN-γ, IL2 and IFN-γ+IL2 activities to whole sporozoites were measured pre-immunization (Pre), after each immunization (1, 2, 3, 4, 5) and after CHMI (Post-C); subjects in Cohort 1 only were also measured 7 days after the first immunization (1*). Cohort 1 and Cohort 2 protected and non-protected subjects are shown by indicated symbols. Geometric means are indicated by red bars. Panel A: IFN-γ: Geometric mean activities in both Cohorts significantly rose (p = <0.001) after the first immunization and were higher in Cohort 1 than Cohort 2 after the first and second immunizations (see text). In Cohort 2, activities significantly rose after the fifth immunization. Panel B: IL2: Geometric mean activities in both Cohorts significantly rose (p = <10−3) after the first and second (p = <0.01) immunizations and activities of Cohort 1 were significantly higher than Cohort 2 after the first and second immunizations (see text). In Cohort 2, activities significantly rose after the third and fifth immunizations. Panel C: IFN-γ+IL2: Geometric mean activities in both Cohorts 1 were significantly higher after the first immunization, and activities of Cohort 1 were higher than Cohort 2 after the first and second immunizations (see text). In Cohort 2, activities significantly rose after the third and fifth immunizations.

