
Figure 1. An operant conditioning assay for larval zebrafish combined with whole-brain calcium imaging.
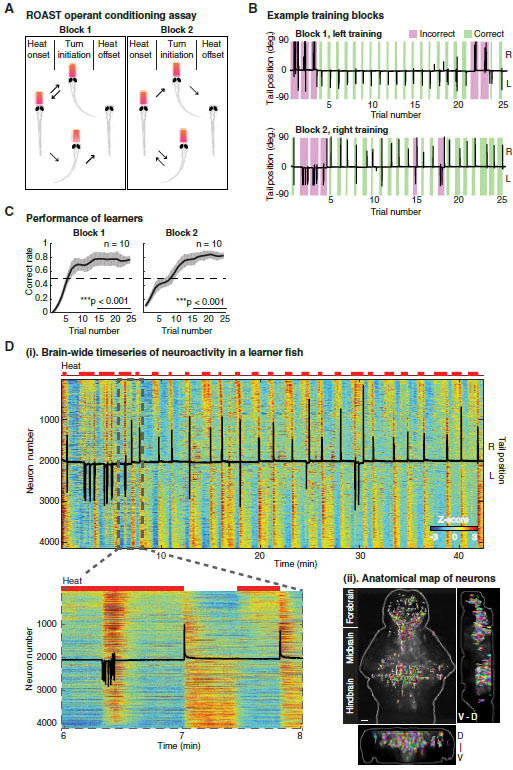
(A) Relief of Aversive Stimulus by Turn (ROAST). Head-fixed larval zebrafish receive a mildly aversive heat stimulus by an infrared laser (red trapezoid) at the beginning of a trial. The laser is turned off if the fish makes a tail movement in the reward direction and remains on otherwise. In the second training block the reward direction is switched, with each block consisting of 20–25 trials (see STAR Methods).
(B) The learning progress (two blocks) of an example learner (8 dpf). Black traces indicate tail positions over time, magenta and green rectangles indicate the duration of the heat stimulus for each incorrect and correct trial, respectively.
(C) Averaged performance as a function of trial number (mean ± SEM, n = 10). The correct rate in the first 10 trials is significantly below 0.5, **p = 0.001 for block 1 and *p = 0.012 for block 2; the correct rate in the last 10 trials is significantly above 0.5, ***p < 0.001 for both blocks (bootstrapping, n = 5000).
(D) (i) Heat map of brain-wide neuronal time series (Z-scored) from a learner with top 2% most active voxels extracted and segmented, resulting in 4124 neurons. Neurons sorted by their correlations with heat stimuli, from highly positive to highly negative. Upper red bars: heat stimuli; superimposed black trace: tail position of the fish; lower panel: zoom into the dashed rectangular area.
(ii) Anatomical map of same extracted neurons as in (i), displayed in random colors for clarity. Scale bar, 50 μm.