
Figure 2. Decision making relies on coordination and integration of distributed information across the whole brain.
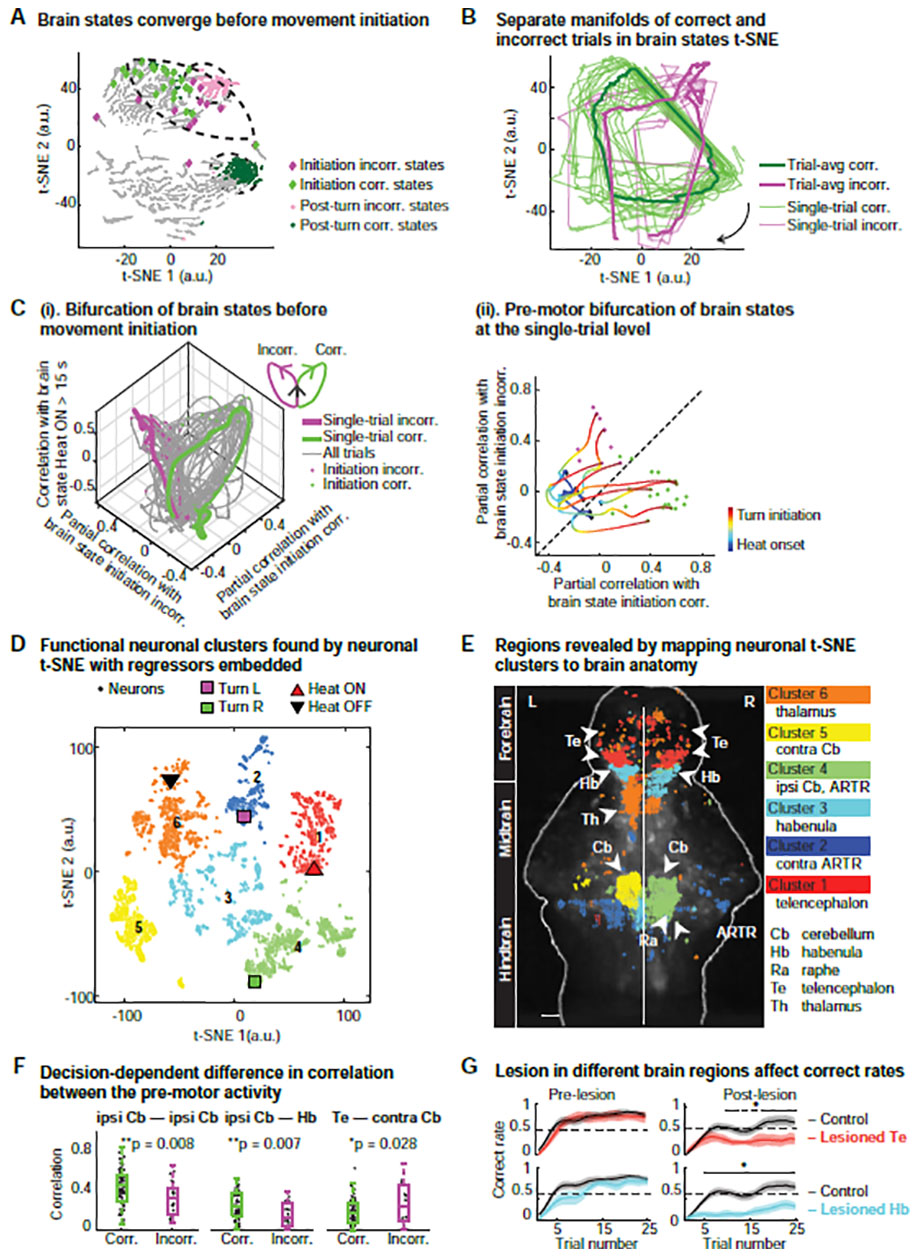
(A) Brain states for a given trial type (correct or incorrect) converge into a smaller region of the t-SNE space before turn initiation (diamonds; incorrect (incorr.): magenta, correct (corr.): green) and are well-separated post turn, i.e. 0–10 s after movement initiation (circles; incorrect: magenta, correct: green). See also Figure S2C,D.
(B) Temporal evolution of brain states during correct versus incorrect trials lie on separate cyclic manifolds, visualized in a 2D map; single trials (thin lines) and trial averages (thick lines); arrow: direction of temporal evolution. Manifold separation measured with Hausdorff distance (Bruno et al., 2017), ***p < 0.0001, Wilcoxon rank sum test.
(C) Performance-dependent bifurcation of brain states before turn initiation. See STAR Methods.
(i) After heat onset, brain states exhibit similarity along the “Heat ON” dimension (vertical axis), followed by a pre-turn bifurcation towards the correct or incorrect state. Similarity is measured by partial correlation between a given brain state and the average correct, incorrect or “Heat ON” state.
(ii) 2D representation of single-trial bifurcation process. Individual correct and incorrect trials are highlighted during the pre-motor period (Black diamonds: heat onset, green and magenta dots: turn initiations for correct and incorrect turns, respectively). See also Movie S2.
(D) Application of t-SNE on neuron space reveals six distinct functional clusters of neurons (different colored circles) with behavior and stimulus regressors embedded in a 2D t-SNE map (triangles and squares). The t-SNE map is partitioned by hierarchical clustering (see STAR Methods). The “Heat ON” regressor (red triangle) is located in Cluster 1, “Heat OFF” in Cluster 6 (black triangle), “Turn R” in Cluster 4 (green square) and “Turn L” in Cluster 2 (magenta square).
(E) Mapping of functional neuronal t-SNE clusters onto brain anatomy reveals distinct overlap with specific anatomical regions. Cluster 1 is mainly in the telencephalon (Te); Cluster 2 in the left hindbrain contains “Turn L” regressor and overlaps with the left ARTR; Cluster 3 overlaps with the habenula (Hb) and the raphe (Ra); Cluster 4 contains “Turn R” regressor and overlaps with right (ipsilateral) cerebellum (Cb) and ARTR; Cluster 5 overlaps with the left (contralateral) cerebellum (Cb); Cluster 6 overlaps mainly with thalamus (Th) and parts of the Te and contains the “Heat OFF” regressor. Scale bar, 50 μm.
(F) Performance-dependent trial-by-trial changes in correlation between pre-motor neuroactivity across brain regions. The absolute correlation of activity within the ipsilateral cerebellum (ipsi Cb) and between the ipsi Cb and other brain regions (Hb) increases in correct trials (green circle) compared to incorrect trials (magenta circle). Between other brain regions (e.g. between Te and contra Cb), correct trials exhibit a lower degree of correlation than incorrect trials. In particular, the difference in correlation between the ipsi Cb and Hb for correct versus incorrect trials is highly significant. Two-tailed t-test, *p < 0.05, **p<0.01. See also Figure S2F.
(G) Lesions in the habenula and telencephalon affect the correct rate and learning. Larvae that were lesioned in the Hb or Te exhibited a significant decrease in correct rate post-lesion compared to unlesioned larvae. n = 15 for the control group without lesion; n = 9 for the Te lesion group; n = 10 for the Hb lesion group. Wilcoxon rank sum test, one-tailed.