
Figure 3. Preparatory activity in the cerebellum is highly predictive of decision outcome and emerges through training.
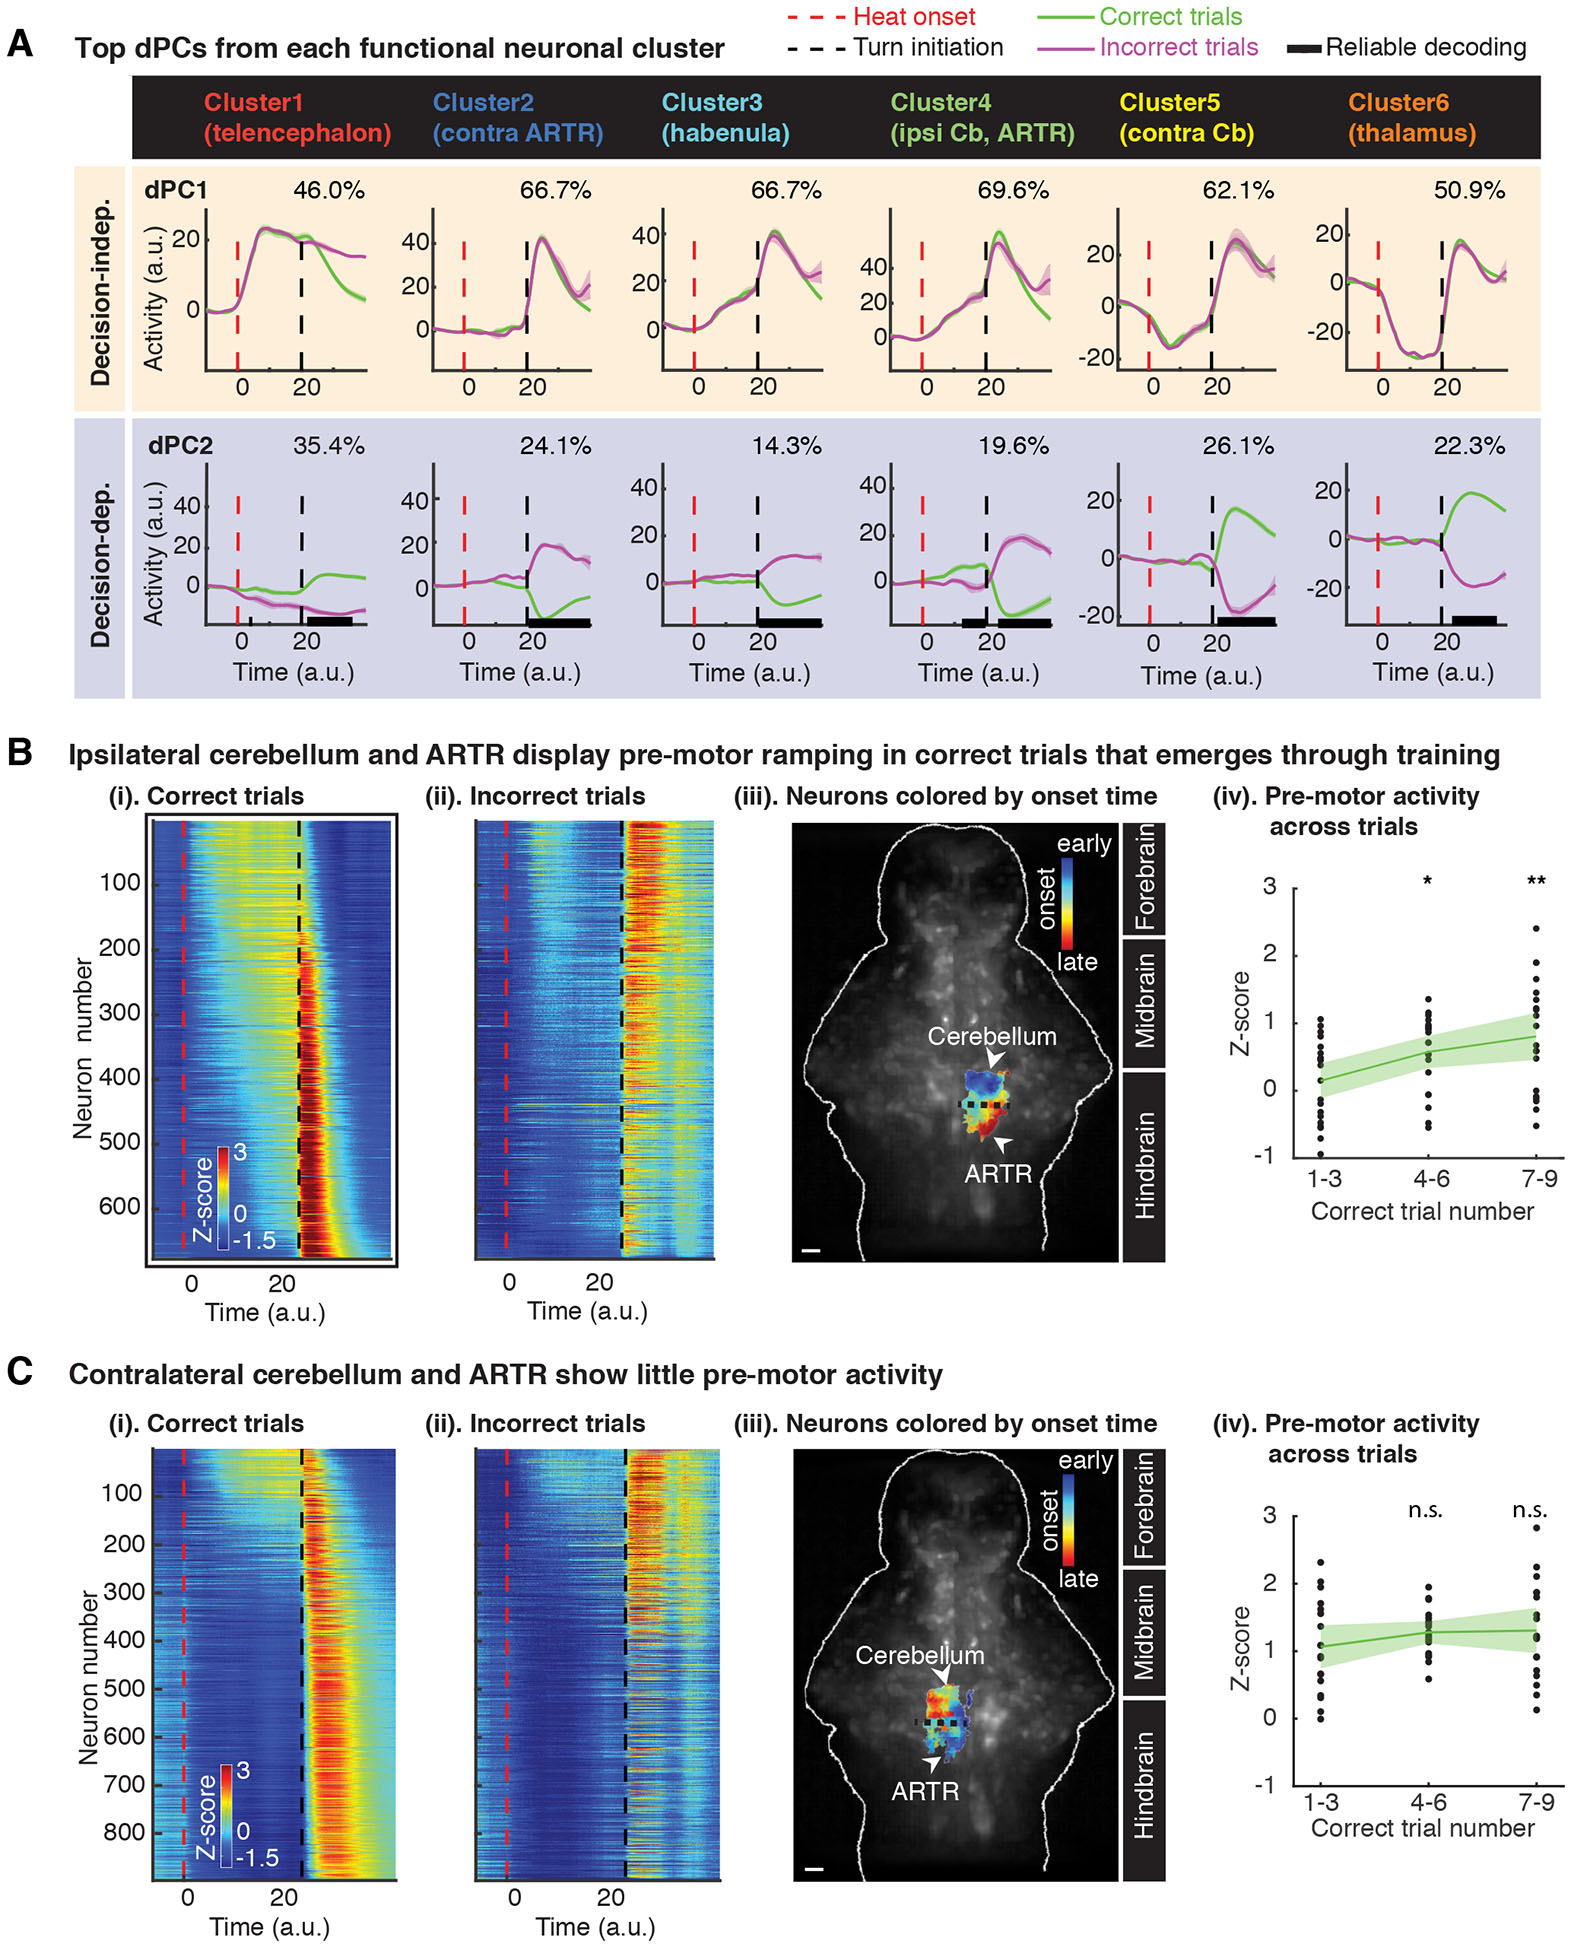
(A) Top demixed principal components (dPCs) from each functional neuronal cluster. Population activity from each cluster was projected onto individual dPCs and averaged over trials (lines and shaded bands: mean ± 1.96 SEM). Explained variance for each dPC is given at the top right of each panel. Horizontal black bars on x-axis mark timepoints when correct versus incorrect trials can be reliably decoded (see STAR Methods). Pre-motor decision-dependent signal (in which the time of decoding precedes and lasts until turn initiation time) is observed from dPC2 of Cluster 4, the ipsi Cb and ARTR. Post-turn decoding is reliably possible from the dPC2 of all functional clusters, but only Cluster 4 allows for reliable pre-motor decoding. Time series were processed for co-alignment from heat onset to turn initiation, i.e. the decision time (see STAR Methods).
(B) Ipsilateral cerebellum and ARTR display strong pre-motor ramping activity in correct trials that emerges through training.
(i) & (ii). Pre-motor activity of individual neurons in ipsi Cb and ARTR averaged over correct or incorrect trials. Neurons in both panels are sorted according to onset timing of pre-motor activity during correct trials. Red dashed lines, heat onset; black dashed lines, turn initiation.
(iii). Anatomical locations of ipsilateral neurons color-coded according to the onset time of their pre-motor activity. Onset time of activity increases from anterior (Cb) to posterior (ARTR) in the ipsilateral hindbrain. Background: anatomical reference. Scale bar: 50 μm.
(iv). Pre-motor activity, averaged from individual neurons, significantly increases with training. Each dot represents pre-motor activity from a single trial. Trials are combined across 7 datasets. *p < 0.05, **p < 0.01, ***p < 0.001, two-tailed Wilcoxon rank sum test.
(C) Contralateral cerebellum and ARTR show little pre-motor activity.
(i) & (ii). Pre-motor neuroactivity of individual neurons in contra Cb and ARTR averaged over correct or incorrect trials. Neurons in both panels are sorted according to the onset time of pre-motor activity during correct trials.
(iii). Anatomical distribution of contralateral neurons, which are color-coded according to the onset time of their pre-motor activity. Onset time of activity increases from posterior (ARTR) to anterior (Cb) in the contralateral hindbrain. Background: anatomical reference. Scale bar, 50 μm.
(iv). Preparatory activity, averaged from individual neurons, shows no significant change as training progresses. Each dot represents pre-motor activity from one trial. Trials are combined across the same animals as in B. Two-tailed Wilcoxon rank sum test.