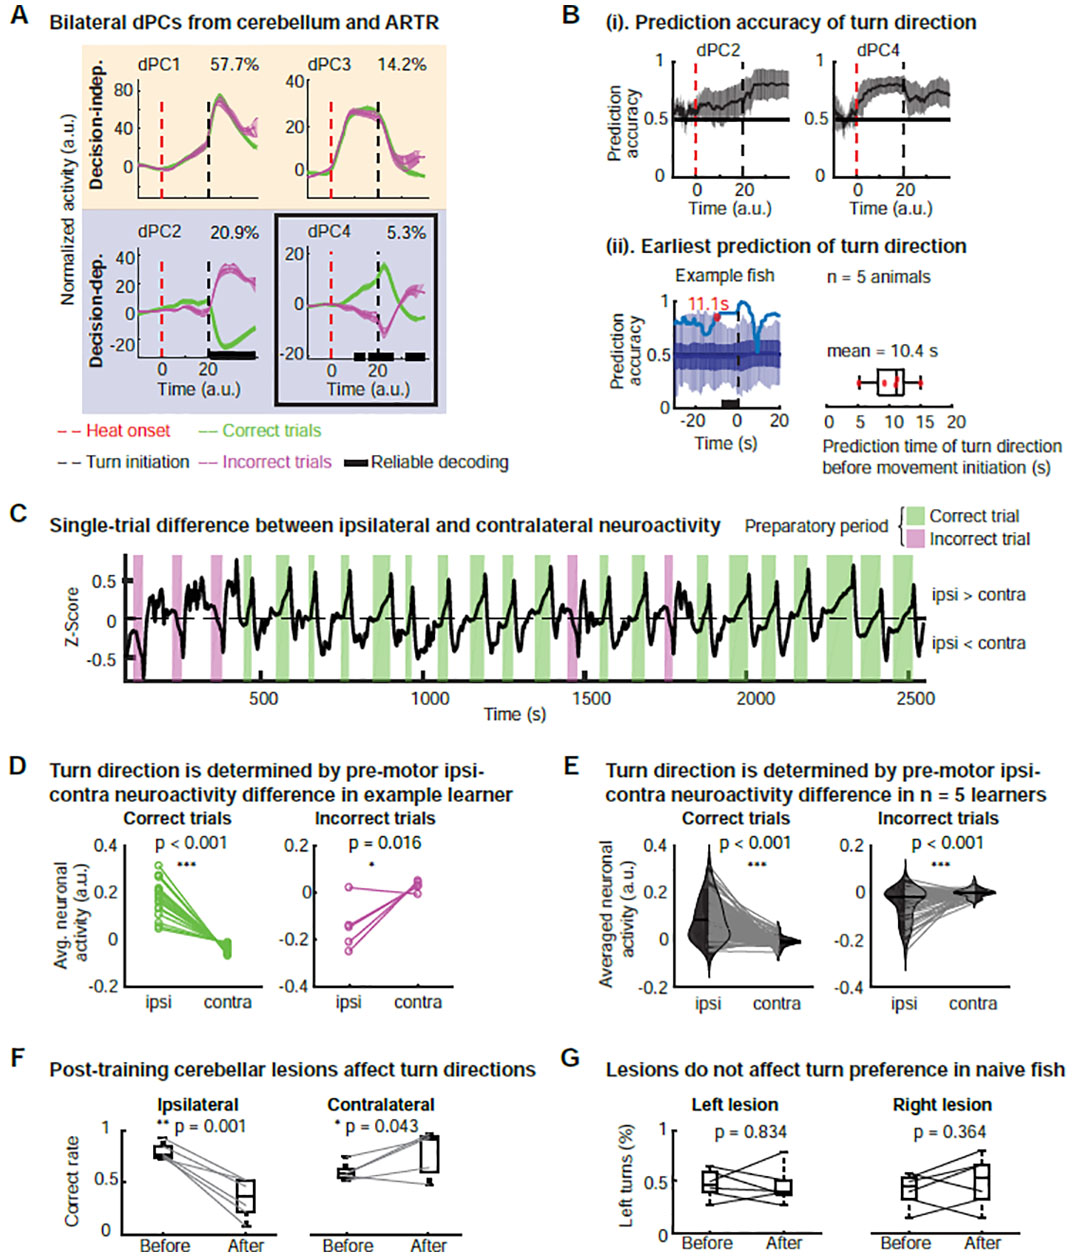
Figure 4. Bilateral ipsi-contra competition in the cerebellum determines decision outcome.

(A) Bilateral dPCA analysis of joint neuroactivity of cerebellum (Cluster 4 and Cluster 5). Decision-independent dPCs: dPC1 displays pre-motor ramping and post-turn peak; dPC3 displays a plateau shape for most of the decision time, representing the heat- and motor-evoked signals. Decision-dependent dPCs: dPC2 shows post-turn separation, which could serve as a feedback signal; dPC4 displays pre-motor separation, the signal to plan and drive action selection. Data from a representative fish.
(B) Decision direction can be predicted as early as 10 seconds before movement initiation with an average accuracy of 80%.
(i) Prediction accuracy for correct versus incorrect turns extracted from decision-dependent dPCs. dPC2 displays post-turn classification of correct versus incorrect trials while dPC4 allows for pre-turn prediction of turn direction, with an average accuracy as high as 80%. Prediction accuracy from n = 8 training blocks of 5 learners, mean ± 1.96 SEM.
(ii) The prediction timepoint (red dot) in an example learner. Dark blue line and shaded band: mean and SD of shuffling tests (n = 100). See STAR Methods and Figure S3D.
(iii) Earliest prediction times from 7 learner datasets, in 5 of which prediction precedes movement initiation (mean prediction time: 10.4 s).
(C) Pre-motor difference neuroactivity between the ipsi and contra Cb as a function of time. Data are constructed from the pre-motor decision-dependent activity from an example learner (see Figure S4D).
(D) Trial-by-trial comparison of pre-motor neuroactivity between ipsi and contra sides for correct versus incorrect trials of an example learner. Wilcoxon signed rank test, one-tailed. See STAR methods.
(E) Trial-by-trial comparison of pre-motor neuroactivity between ipsi and contra sides for correct versus incorrect trials. Data pooled across 5 learners, with 144 correct trials and 56 incorrect trials. Wilcoxon signed rank test, one-tailed.
(F) Post-training lesions in the cerebellum affect the distribution of turn directions. Laser-induced lesions in the ipsi Cb (n = 6) result in a significant decrease of the correct rate, while lesions in the contra Cb result in a mild increase of the correct rate (see discussion, n = 5). Each gray line represents one two-block learner animal. Only trials with behavioral responses are used for calculating the correct rate. One-tailed t-test.
(G) Lesions in naïve animals do not affect the distribution of turn directions. The fraction of left turns before and after lesion was counted in freely behaving zebrafish without exposure to any heat stimulus. n = 6 for lesions in each side, two-tailed t-test.
